
The DSO Illusion: Why Global Payment Terms Look Fine While the Supply Chain Drowns
An analysis of why aggregate payment-terms data concealed the largest supply-chain shock in a decade, what the composition effect does to every benchmark you rely on, and the measurement discipline that would have caught it. Data current to August 2026; interpretation is my own.
Two findings, published six weeks apart, by two of the most credible institutions in trade credit.
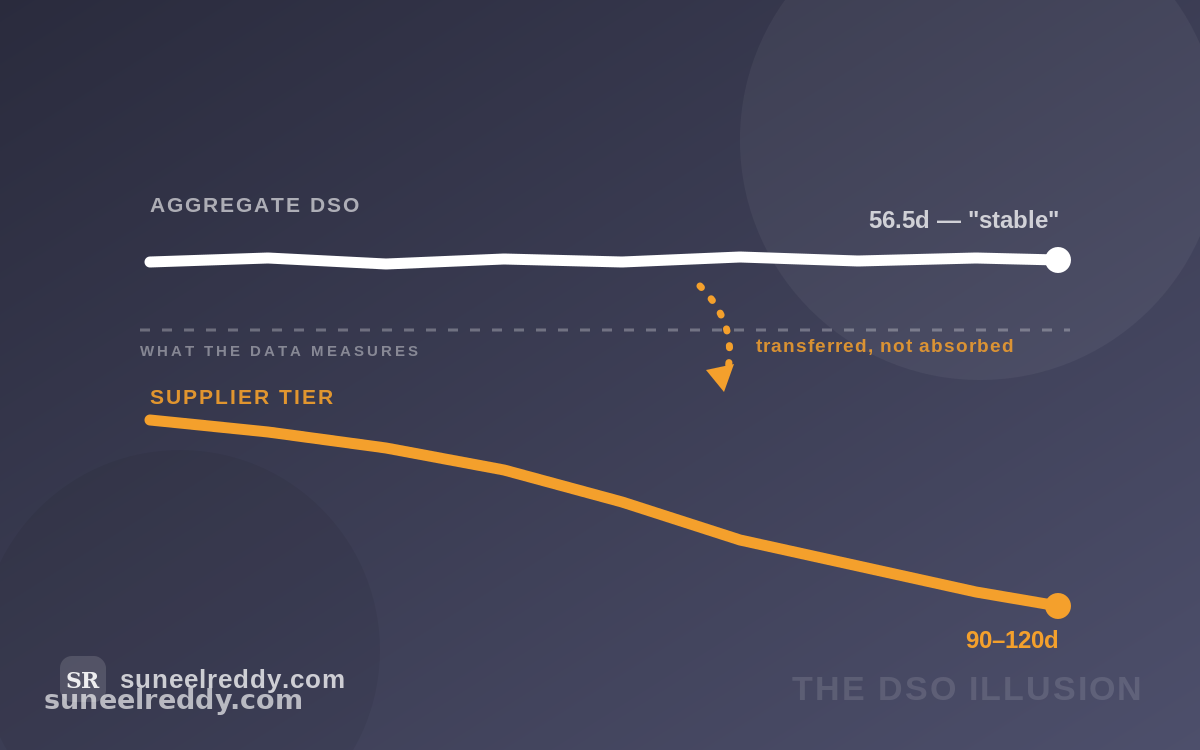
16 July 2026 — Allianz Trade. Global DSO stands at 56.5 days. It rose 0.3 days last year. It has been stable since 2022. It remains roughly three days below the pre-pandemic norm.
11 August 2026 — Atradius. More than 80% of suppliers in Asia report late payment, with close to a third of B2B receivables overdue. In Central and Eastern Europe, 83% report delays. In Western Europe, four in five companies are affected.
Between those two publications sits a war that closed the Strait of Hormuz, took OPEC production down by more than 30%, and pushed freight rates on some India–Gulf lanes up by a factor of ten to fifteen. Indian MSME payment cycles stretched from 30–40 days to 90–120.
And global DSO improved slightly.
Either one of these datasets is wrong, or the metric everyone uses to monitor payment behaviour cannot see what just happened. It is the second one.
Part I — Reconciling the contradiction
The two numbers are not in conflict because they are not measuring the same population.
Allianz's DSO series is built from company financial statements — predominantly large, listed corporates. Atradius's barometer is a survey of suppliers, asking whether they get paid on time.
Every large corporate's DSO is some supplier's DPO. When a buyer with pricing power responds to a cost shock by extending payment, that buyer's working capital is unaffected — the receivable turns over as before, because they are still being paid on their own terms. The stress lands one tier down, on a supplier who cannot dictate terms and often does not appear in any listed-company dataset at all.
So the aggregate held. Not because the shock was absorbed, but because it was transferred.
This is the same mechanism I have written about at the level of a single ledger — an invoice unpaid is a loan you did not price. What the 2026 data shows is that mechanism operating at continental scale, as a systemic transfer of working-capital burden from the balance sheets that get measured to the ones that do not.
Part II — Three reasons aggregate DSO is structurally blind
The illusion is not an accident of this particular shock. It is built into the metric.
- Sample bias. Financial-statement DSO series are drawn from listed and large private companies. The firms absorbing the transfer — small suppliers, unlisted MSMEs, the informal tier below them — are largely absent. A metric computed on the winners of a transfer will always look stable during a transfer.
- Netting. A buyer stretching payables and a supplier suffering it are both inside a broad enough index. Their movements offset. The aggregate reports calm while the distribution pulls apart at both ends — which is precisely what the dispersion data shows: a quarter of firms now run a cash conversion cycle below 43 days, another quarter above 107.
- Terms versus behaviour. DSO conflates two different things: the credit you granted and the lateness you are suffering. A book where terms tightened but delinquency worsened can print an unchanged DSO. Without decomposing into Best Possible DSO and Average Days Delinquent, the headline number is a blend of a policy decision and a performance failure, and you cannot tell which moved.
Any one of these would blunt the signal. Together they make aggregate DSO close to useless as an early-warning instrument for exactly the event it appears to be designed to detect.
Part III — Where the shock actually landed
Two places, neither of them the receivables line.
Inventory. Global DIO reached 53 days in 2025 against a pre-pandemic 48, and now explains roughly 80% of the cash conversion cycle. The behavioural shift is explicit: firms are abandoning “just-in-time” for “just-in-case,” accepting tied-up capital in exchange for supply security. Allianz forecasts DIO up around two more days in 2026, and estimates each additional DIO day translates to +1.16 days of CCC globally — notably milder than the 2022 shock, which added five days to CCC outright.
Sector divergence is the tell. Twelve of twenty sectors extended their cycle; eight compressed it. Extending: automotive suppliers +4 days, paper +3, metals +3, textiles +3 — upstream manufacturing building buffers. Compressing: transport equipment −6, computers and telecom −4, energy −3 — sectors with pricing power, policy support and structural demand. The split is not about operational competence. It is about who can pass costs on.
The tier below the data. In India, freight on affected lanes went from $200–300 to roughly $3,000. Marine war-risk premiums rose by up to 1,000%. Roughly half the export cycle was disrupted. CRISIL estimated basmati exporters needed 10–15% more working capital debt simply to keep operating. In Morbi, 450 of 650 ceramic units suspended production, with daily billing at some units collapsing from about ₹3 lakh to ₹25,000–30,000.
None of that is visible in a global DSO series. All of it is a working-capital event.
Part IV — The baselines
If the aggregate is unreliable as a signal, it is still useful as a yardstick. Current readings against their own history:
| Measure | Current | Historical reference |
|---|---|---|
| Global cash conversion cycle | 67 days | 10-year average 64; 2023 peak 68 |
| Global DIO | 53 days | Pre-pandemic 48 |
| Global DSO | 56.5 days | Pre-pandemic norm ~59 |
| Working capital requirement (2024) | 78 days | Highest since 2008 |
Country-level payment terms, which vary far more than most cross-border credit policies assume:
| Country | DSO (days) |
|---|---|
| Italy | 66 |
| Spain | 62 |
| France | 58 |
| United States | 49 |
| Germany | 45 |
| United Kingdom | 38 |
| South Korea | 27 |
And by sector, where the spread is wider still: construction 65–80 days; pharmaceuticals around 70 — with the Hackett Group putting pharma's full cash conversion cycle near 186 days in 2025 on the back of biologics and GLP-1 investment; software roughly 58; manufacturing 45–60; retail 15–25.
A methodological caution worth stating plainly: these figures come from different vintages and different methodologies, and they do not splice into a clean time series. Allianz's 2023 release reported global DSO at 59 days; the 2026 report puts it at 56.5 and calls it stable since 2022. That is a restatement, not a 2.5-day improvement. Treat each series as internally consistent and externally incomparable — which is itself an argument for measuring your own book rather than benchmarking your way to a conclusion.
Part V — What to measure instead
Four instruments, in ascending order of how much they would have told you this year.
- Decompose DSO. Best Possible DSO isolates the terms you granted; Average Days Delinquent — the gap between actual and best-possible — isolates the lateness you are suffering. One is a pricing decision, the other a collections problem. A single blended DSO hides both.
- Track roll rates, not balances. The share of last month's 1–30 bucket that moved to 31–60 this month is a transition matrix, and it flattens months before write-offs appear. Balances are a photograph; roll rates are a trajectory.
- Use CEI over DSO for management reporting. The Collection Effectiveness Index measures what share of collectable receivables you actually collected, and is far less distorted by sales seasonality. Above 80% is strong, 85%+ very strong.
- Measure your suppliers, not just your customers. This is the one almost nobody does, and it is the direct lesson of the transfer mechanism. If your DPO improved this year, ask what happened to the firms on the other side of it. A supplier base quietly financing you is a supply-chain risk sitting on your P&L as a working-capital gain — right up to the moment one of them fails and takes a production line with it.
You can run the first three on your own book in the working capital and DSO calculator — it computes DSO, Best Possible DSO, ADD, CEI and the full cash conversion cycle, and splits any improvement target into the days collections can recover versus the days that require renegotiating terms.
Part VI — What follows
For lenders. A borrower's stable DSO is not evidence of health if their DPO also lengthened; they may simply be stronger than their suppliers. And the credit question migrates: underwriting a mid-market manufacturer now means underwriting the survival of its supplier base, because a supplier insolvency is a production stoppage with the same P&L signature as a demand collapse. Allianz projects global insolvencies up 6% in 2026, with one-third of that increase attributable to Middle East spillovers.
One caveat on that forecast, and it is mine rather than theirs. The April projection explicitly assumed “a progressive normalization of traffic through the Strait of Hormuz by June.” In early August, MarineTraffic recorded 8–15 daily transits against roughly 130 before the conflict. The assumption has not held. Allianz's own prolonged-conflict scenario — insolvencies nearer +10% in 2026 — is now the more defensible planning case, and anyone still working from +6% is using a superseded input.
For suppliers. The structural answer to a buyer who lengthens terms is not better chasing. It is instruments that move the receivable off your balance sheet — receivables finance, factoring, or anchor-backed discounting where the buyer is investment-grade. India's response has leaned this way: RBI extended export credit repayment to 450 days and realisation from nine to fifteen months, and ECLGS 5.0 has issued over 4.1 lakh guarantees worth ₹1.55 lakh crore, 98% of them to MSMEs. Useful, but all of it is liquidity against a receivable that is still late. It buys time; it does not shorten the cycle.
For everyone. The metric that says nothing happened is not evidence that nothing happened. It is evidence that the metric is measuring the wrong population. In a year when the aggregate held steady and the tier below it went into distress, the most dangerous number on the dashboard was the reassuring one.
References
Allianz Trade — Global DSO & Cash Conversion Cycle Report, 16 July 2026 (global CCC 67 days, DIO 53, DSO 56.5, sector dispersion, 2026 forecast); Global Insolvency Outlook 2026–27, 22 April 2026; country payment-term data (2023–24 vintage). Atradius — B2B Payment Practices Barometer 2026, published 11 August 2026 (Asia, CEE, Western Europe, UAE). The Hackett Group — 2026 Working Capital Report (pharma CCC ~186 days; semiconductor revenue +32%); 2025 US Working Capital Survey. CRISIL, Upstox, Policy Circle — India MSME freight, payment-cycle and sector data, April 2026. MarineTraffic via Al Jazeera — Strait of Hormuz transit counts, August 2026. All figures as published; interpretation and the Hormuz-assumption caveat are my own.