
One Invoice, Four Altitudes: A Data Framework for Sales, Credit, Collections, AR, AP and Cash
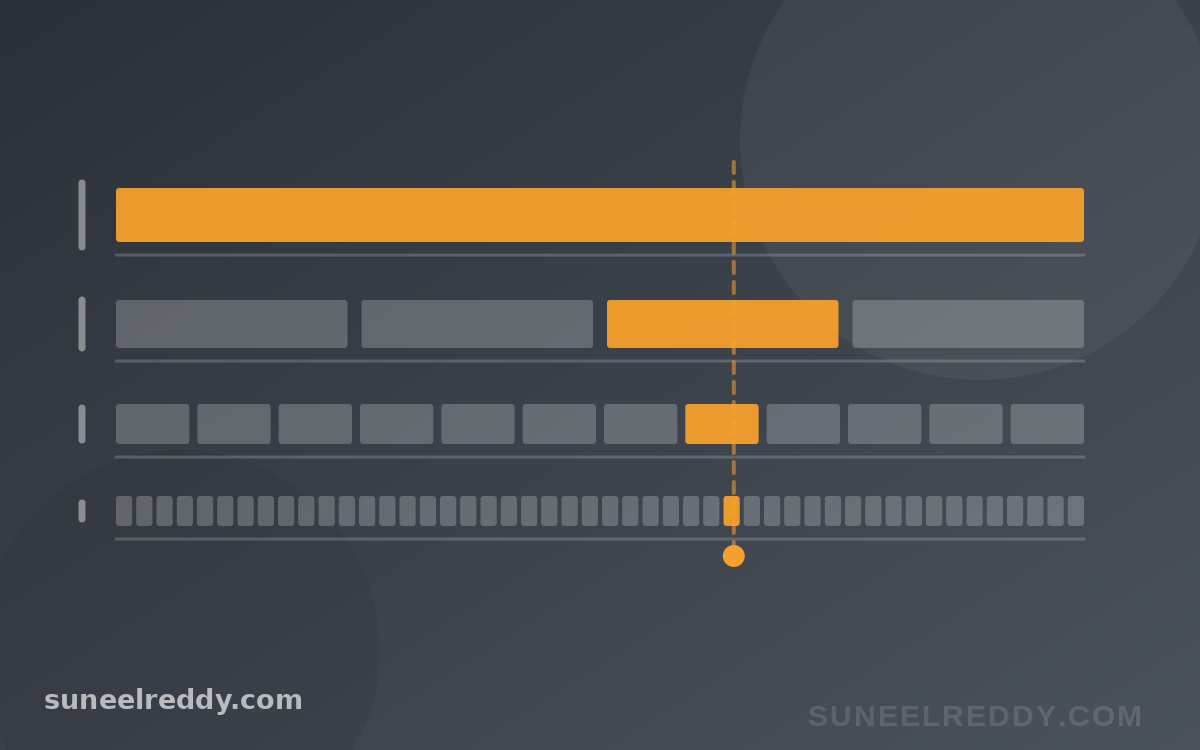
One overdue invoice is four different objects.
To the collector working the queue, it is the next call. To the collections manager, it is one member of a cohort about to roll from 60 days to 90. To the CFO, it is a component of DSO and a line in the dispute bucket. To the board, it is capital that was supposed to be cash by now.
Same record. Four altitudes. Four completely different right answers about what to measure, how often to refresh it, and which chart tells the truth rather than a flattering version of it.
Most reporting packs get this wrong in a specific and repeatable way — not by measuring the wrong things, but by delivering the right things to the wrong floor. The aging report emailed to collectors. Transaction detail buried in a board pack. A monthly extract feeding a weekly decision. None of these are data problems. They are altitude problems, and they are cheap to fix once you can see them.
So I built the grid I wish someone had handed me fifteen years ago: four management levels against six domains — sales, credit, collections, receivables, payables and cash. Twenty-four cells. Each carries the decision it actually serves, the metrics that inform it, the right chart form, the refresh cadence, and the mistake almost everyone makes in that particular square.
Open the interactive framework — click any cell for the detail. Every cell also draws its chart out on illustrative data, so “waterfall” and “roll-rate grid” are shown rather than named.
The shape of it
The cadence gradient is the easiest way to see the structure. Nothing here is arbitrary: each altitude's refresh rate is set by how fast the decision at that altitude actually turns over.
| Altitude | Sales | Credit | Collections | AR | AP | Cash |
|---|---|---|---|---|---|---|
| Board / CEO | Quarterly | Quarterly | Quarterly | Quarterly | Quarterly | Quarterly |
| CFO / function head | Monthly | Monthly | Monthly | Monthly | Monthly | Weekly |
| Manager | Weekly | Weekly | Weekly | Daily–weekly | Daily–weekly | Daily–weekly |
| Analyst / operator | Real time | Per application | Daily | Real time | Real time | Intraday |
And the chart forms move with it. Board cells want indexed lines, stacked areas and waterfalls. Manager cells want sorted bars, roll-rate flows and distributions. Every operator cell wants no chart at all — a status flag or an ordered queue. That is not a gap in the framework. It is the finding.
Six rules that hold in every cell
1. Altitude sets the grain, the cadence and the chart — all three move together
Go up a level and the unit coarsens, the refresh slows, the visual abstracts, and the reader's ability to personally do anything about it falls. These are not four independent design choices. They move as one.
Which gives you a fast diagnostic: a view that breaks the pattern is aimed at the wrong floor. Transaction detail in a board pack. A quarterly aggregate on a collector's screen. Both are real numbers delivered to an altitude that cannot act on them.
2. If the refresh is slower than the decision, the metric is decoration
Test every number you publish against the cycle of the decision it informs.
A weekly collections priority built on a monthly extract is not a slow dashboard. It is an ornament — the decision will have been made, or missed, before the number moves. A cash position refreshed overnight when payment runs go at four in the afternoon. A credit limit reviewed on an annual calendar for an account whose score moved last Tuesday.
This single test removes more reports than any other question I know, and the fix is usually a schedule change rather than a system.
3. The lever is inverted against the data
Here is the structural tension nobody designs around.
The board sees the most lagging numbers and holds the longest lever — policy, terms strategy, capital. The collector sees live data and holds the shortest — one call, one account, today.
So the value in a reporting system is not really the dashboards. It is how fast a pattern visible at the bottom reaches the altitude that can change the policy. A collector who notices that one customer's disputes always cite the same delivery failure has information the board needs and no route to send it. Escalation design beats dashboard design, and almost nobody invests in it.
4. Averages are for the board and almost no one else
DSO. Average days delinquent. Mean approval time. Every one is a distribution flattened into a point.
At board level that compression is the entire job — you cannot govern from a histogram. At every level below it the decision lives in the tail, and the mean actively conceals it. I wrote about the DSO version of this at length in The DSO Illusion: a headline DSO blends the terms you chose to grant with the terms you are suffering, and only the second is a collections problem. The first is a pricing decision wearing a collections costume.
5. One invoice, four objects — and they had better reconcile
The collector's worklist item, the manager's roll-rate cohort member, the CFO's DSO component and the board's working-capital number should all trace to the same invoice on the same day.
When they do not, you do not have one system with four views. You have four systems and a recurring argument about whose number is right.
6. Accounts payable is not the mirror of accounts receivable
This is the one I would push hardest.
Receivables are influenced. Payables are controlled. You negotiate DPO. You choose which early-payment discounts to take. You decide what goes into the payment run and when.
And yet most working-capital packs are receivables-heavy and payables-nearly-blind. That is not an oversight about reporting. It is an oversight about authority — the pack omits the half of the cycle where management has direct say.
Two payables numbers deserve board attention and rarely get it:
- The gap between DPO and your contractual terms. Beyond the terms you actually negotiated, DPO is unsecured borrowing from suppliers at an unpriced rate. It is also the facility withdrawn first, precisely when supply is tight and you need it most. A rising DPO chart presented as a working-capital win deserves a follow-up question about which suppliers are funding it.
- Early-payment discount capture. Terms of 2/10 net 30 work out to roughly a 36% annualised return for paying twenty days early. Uniformly maximising DPO means routinely declining that — among the most expensive financing decisions available, and one that usually happens by default rather than by decision.
How to use this on Monday without building anything
Lay your existing reporting pack over the grid. Three failure modes surface almost immediately.
- Empty cells. Usually the payables column, for the reasons above. Sometimes the sales row — pipeline reviewed without credit status attached, so the rep discovers the problem at order entry, after the customer has already been promised terms.
- Cells filled at the wrong altitude. Ask of every view: can the person reading this make a decision from it, with the authority they hold, inside the horizon they work in? If not, it belongs one floor up or one floor down. Handing a collector an aging report fails this test — a report is not a worklist. Deciding the order is the work, and the system should have done it already.
- Metrics that cannot move before the decision does. Run rule two across the pack. This is where the cheapest wins are, because the fix is a schedule, not a platform.
What the framework does not settle
It does not tell you what good looks like. The thresholds are industry-specific — a 60-day receivable cycle is routine in capital goods and alarming in food retail.
It says nothing about data quality, which sits upstream of all of it and quietly determines whether any of it is true.
And it assumes the four altitudes exist as separate people. In a forty-person company one person occupies all four, in which case the useful thing is not the grid but the reminder to change hats deliberately — rather than staring at the collector's queue and calling it a strategy review.
Open the interactive framework — 24 cells, each with the metrics, the cadence, the trap, and the chart drawn out on worked figures. There is a latency test built in: pick a cell, tell it how often your data actually refreshes, and it will tell you whether you are running a metric or a decoration.