Writing Frameworks Calculators Editorial Government About Shop — Follow The Tail ↗ Let's talk
Interactive Tools

Calculators

The frameworks from the writing, made usable. Each one runs entirely in your browser — nothing is uploaded, stored or sent anywhere.

Multi-Year Property Returns Calculator
Live

Multi-Year Property Returns Calculator

The same six properties as the NOI calculator over a full hold: rent growth or step escalations, renovation, refinance and exit. IRR built up one assumption at a time, an exact profit attribution, the exit cap and price that hit your target, and after-tax returns for Indian owners.

Real estate · US and India · live
Open calculator →
NOI Calculator for Real Estate Investors
Live

NOI Calculator for Real Estate Investors

Build net operating income line by line in dollars or rupees, set the broker's NOI against an underwritten one, see what the gap costs at a cap rate, and size the loan on LTV, DSCR and debt yield.

Real estate · US and India · live
Open calculator →
Public Company Valuation Workbench
Live

Public Company Valuation Workbench

Same company, two buyers. A reverse DCF shows what growth today's price already assumes, checked against a 75-year base rate; an LBO with a returns bridge shows where a buyout fund's return comes from and the highest premium it can pay.

Valuation · retail and buyout · live
Open workbench →
Private Company Valuation Workbench
Live

Private Company Valuation Workbench

Seven valuation methods matched to stage, feeding a live cap table with the option-pool shuffle and a full liquidation waterfall. See what the headline price actually pays founders, earlier investors and new money at every exit.

Valuation · 4 stage presets · live waterfall
Open workbench →
Project Finance Workbench
Live

Project Finance Workbench

A live model across solar, wind, toll road and availability PPP. Debt sculpted to a target cover then held fixed, with tornado sensitivity, a 600-run simulated breach probability, reverse stress to the covenant, and earned-value construction tracking.

Credit & Risk·4 presets · DSCR / LLCR / PLCR · live
Open workbench →
The Working Capital Data Framework
Live

The Working Capital Data Framework

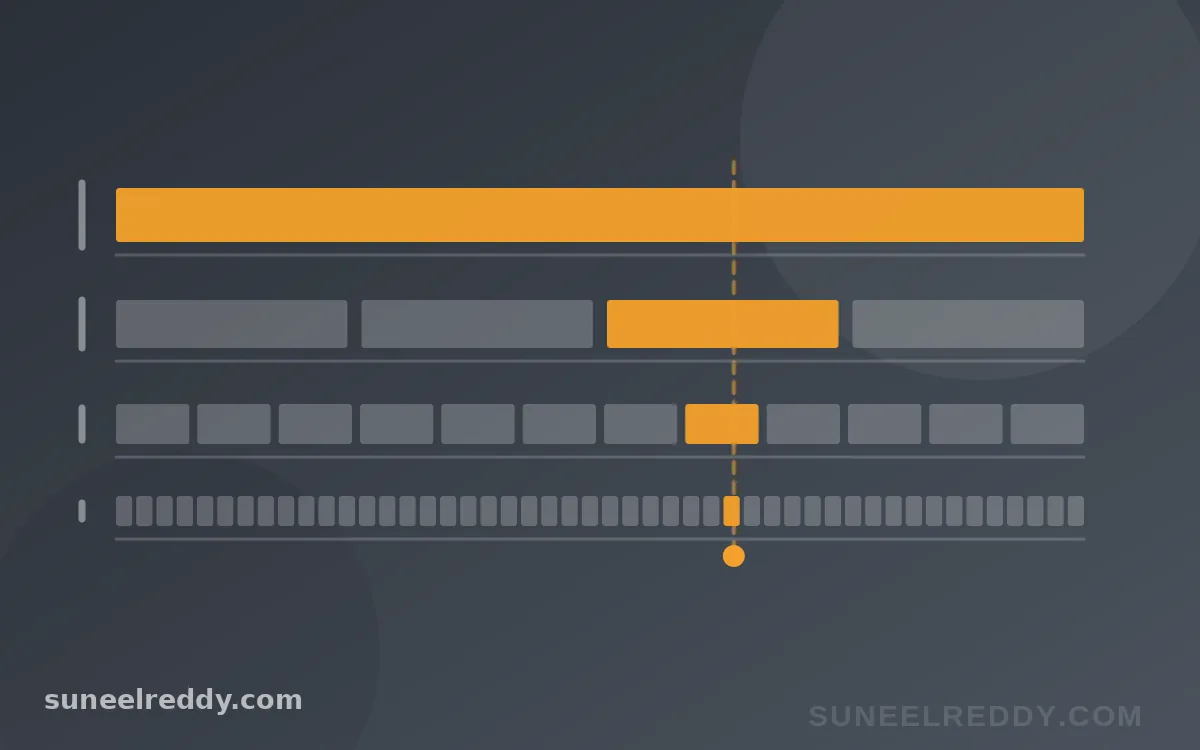
Four management altitudes against six domains — sales, credit, collections, AR, AP and cash. Each of the 24 cells carries the decision it serves, the metrics, the right chart form, the cadence, and the mistake almost everyone makes there.

Data & Strategy·24 cells · 91 metrics · 6 rules
Open framework →
Corporate credit rating scorecard
Live

Corporate Credit Rating Scorecard

Six criteria and 34 factors over three years of financials, where the revenue bucket drives both the weights and the scoring bands. Anchored on S&P financial-risk benchmarks and CRISIL's eight rating parameters, with override caps that no combination of good ratios can outvote.

Credit & Risk·4 revenue buckets · 136 band sets · AAA–C
Open the corporate rating scorecard →
FICO score explainer and estimator
Live

FICO Score Explainer

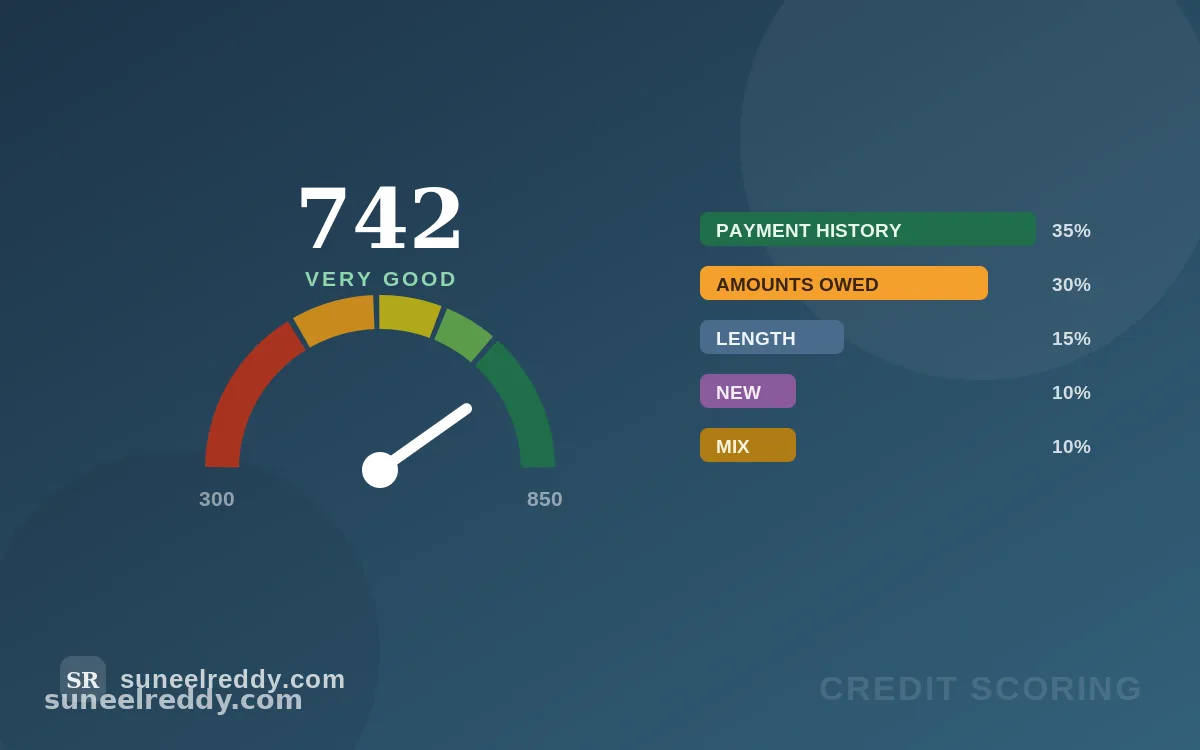
How a credit score is actually built. Move the five weighted factors — payment history, amounts owed, length, new credit, mix — and watch where the points go, which factor is costing you most, and what would genuinely move it.

Credit & Risk·Educational model, not an actual FICO Score
Open the FICO score explainer →
D&B business credit scores explainer
Live

D&B Business Credit Scores

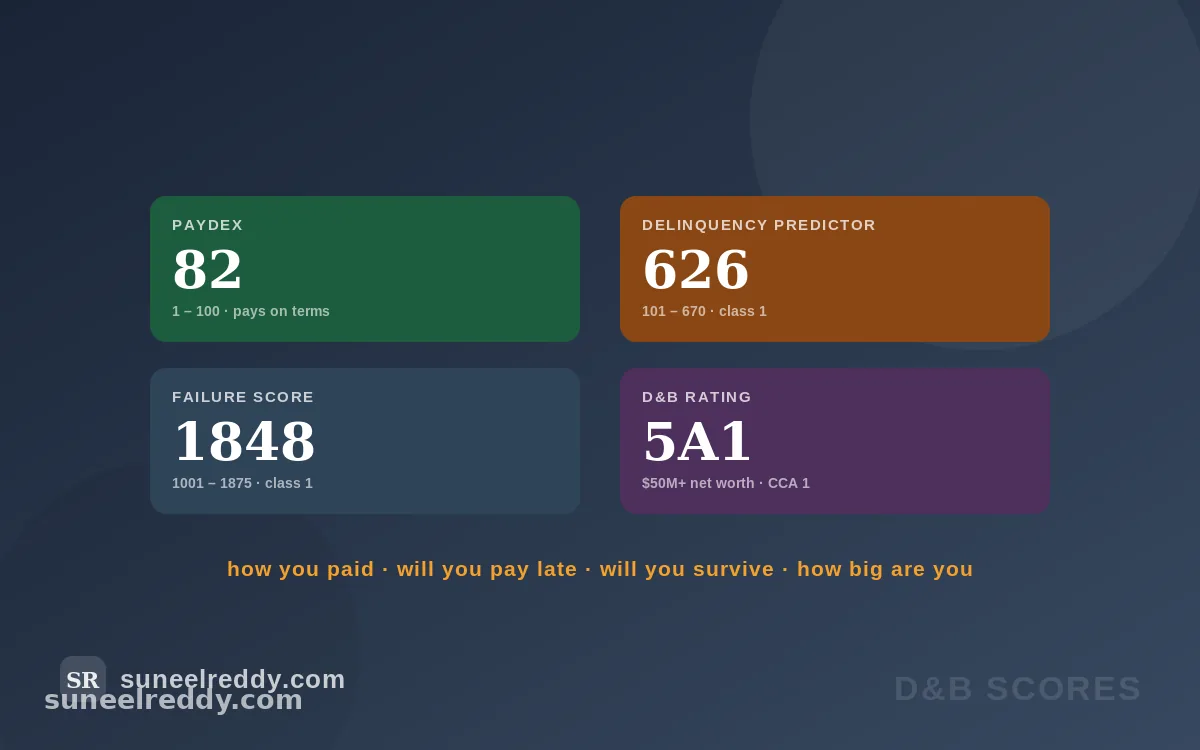
PAYDEX, the Delinquency Predictor (formerly Commercial Credit Score), the Failure Score and the D&B Rating — four measures answering four different questions. Enter trade lines and watch the dollar-weighting decide your PAYDEX.

Credit & Risk·Educational model, not a D&B report
Open the D&B scores explainer →
Auto loan scorecard built with WOE binning and logistic regression
Live

Auto Loan Scorecard

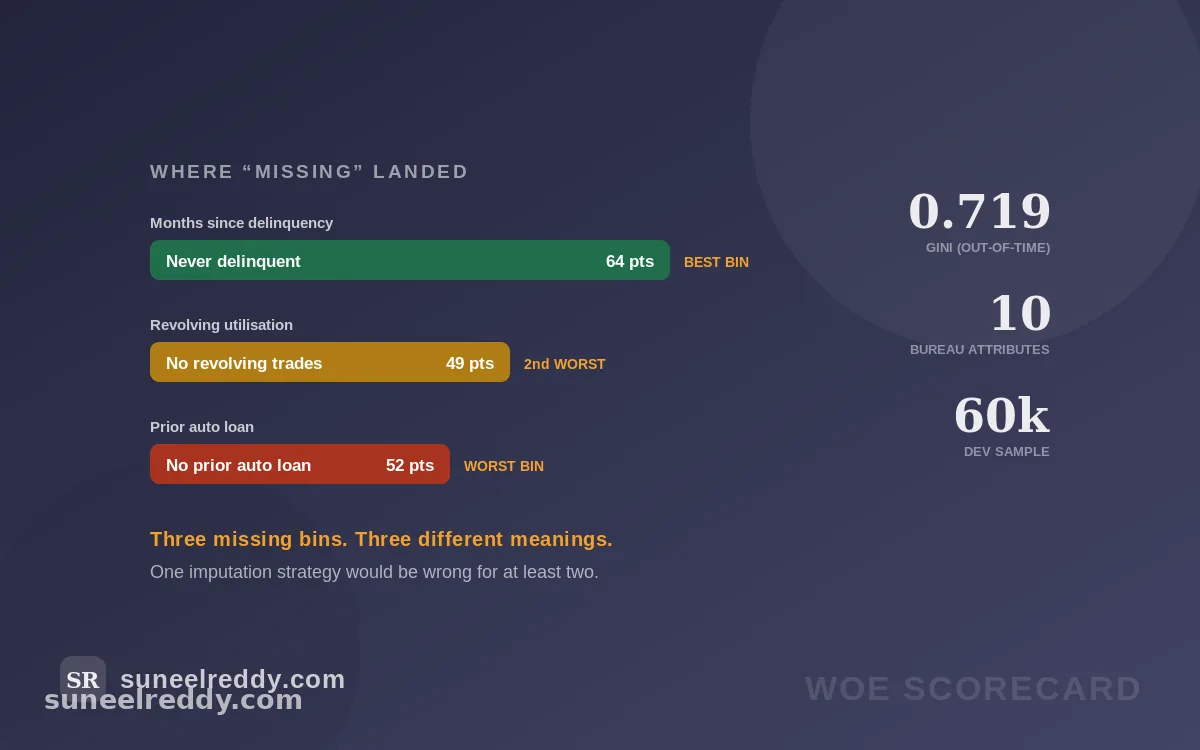
A fitted scorecard, not a mock-up. Ten bureau attributes, weight-of-evidence binned and run through a logistic regression, scaled to points. Every factor has a “not available” option — because missing data is a value, and this model prices it.

Credit & Risk·Gini 0.719 out-of-time · synthetic build
Open the auto-loan scorecard →
Global equipment finance scorecard
Live

Global Equipment Finance Scorecard

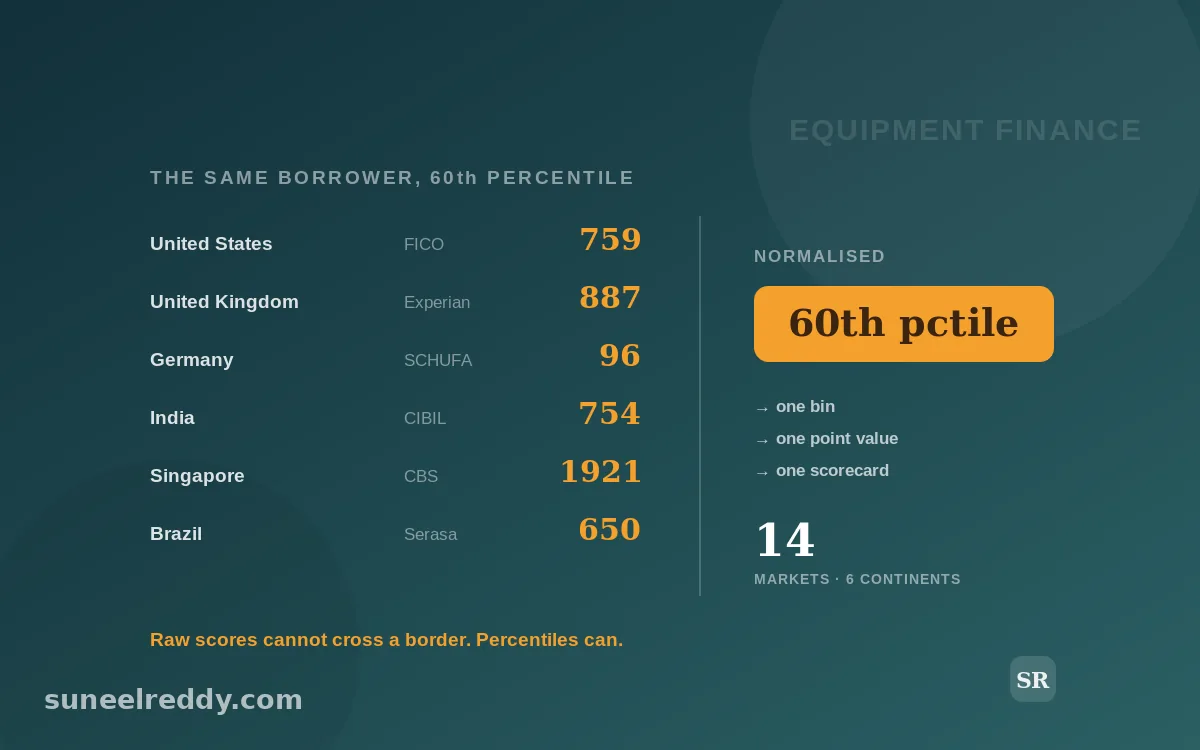
D&B business layer plus a percentile-normalised consumer-bureau guarantor layer, fitted once and deployed across 14 markets on six continents. Swap in NACM, Creditsafe, Intelliscore, Global Database, CRIF or Rapid Ratings and the page shows what the substitution costs in points.

Credit & Risk·14 markets · 9 business bureaus · synthetic build
Open the equipment-finance scorecard →
Global credit data coverage explorer
Live

Global Credit Data Coverage

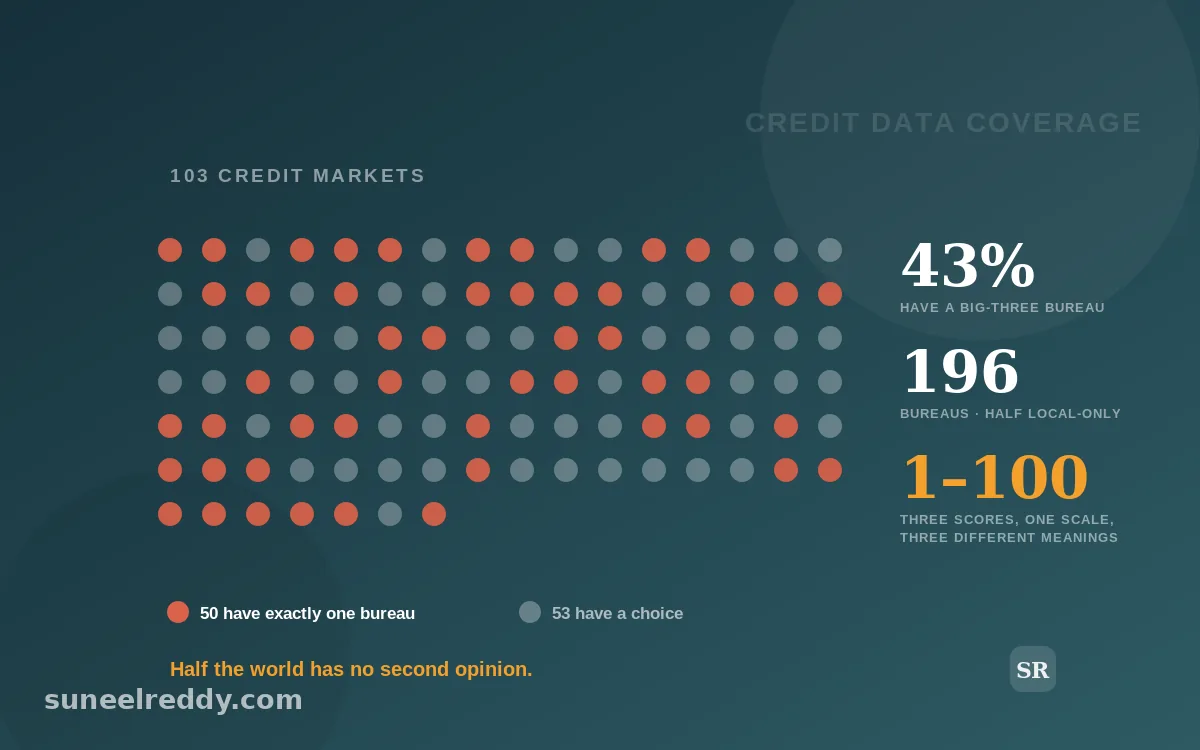
103 countries, 196 bureaus. Half the world’s credit markets have exactly one bureau and only 43% have any of the big three. Explore who operates where, plus the score-scale table showing three bureaus publishing on 1–100 and measuring three different things.

Credit & Risk·Reference · IFC directory + published scales
Open the credit-coverage explorer →
Financial stress forecaster
Live

Financial Stress Forecaster

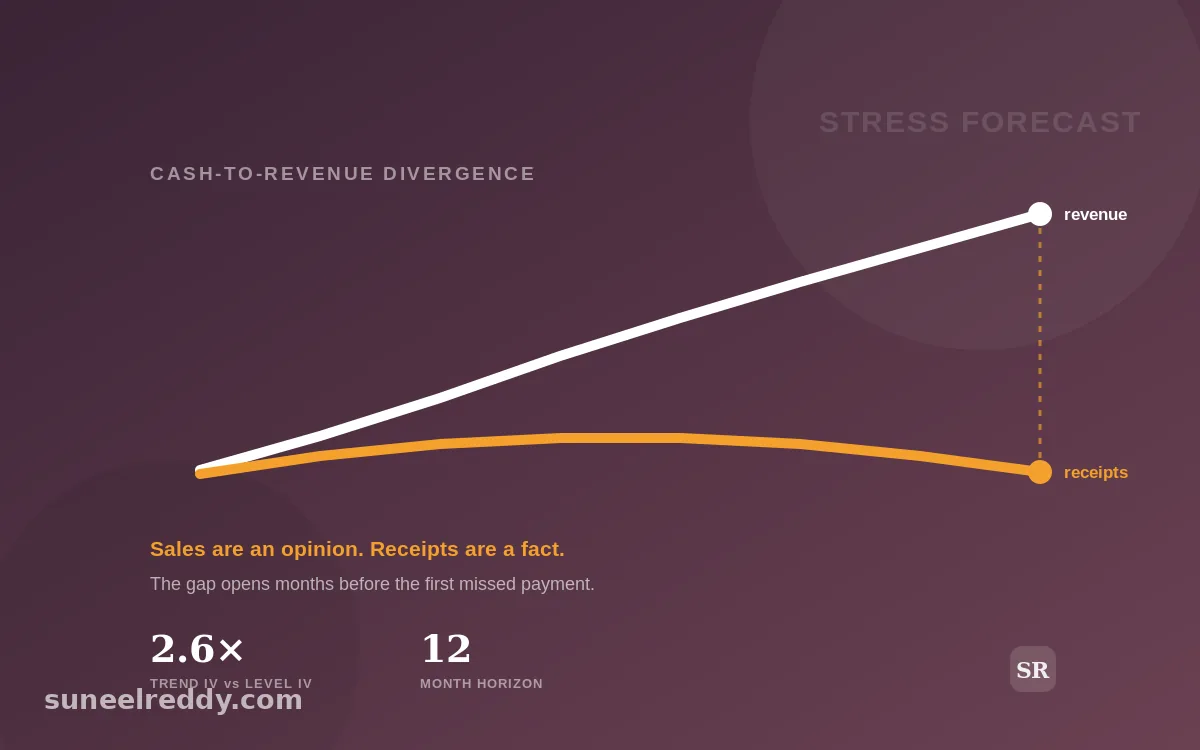
Four quarters of operational data in; a stress index and estimated runway out. Built on the tested finding that trajectory predicts distress better than level — trend features carry 2.6× the information value of current-state measures.

Credit & Risk·12-month horizon · synthetic build
Open the stress forecaster →
Stress scenario simulator
Live

Stress Scenario Simulator

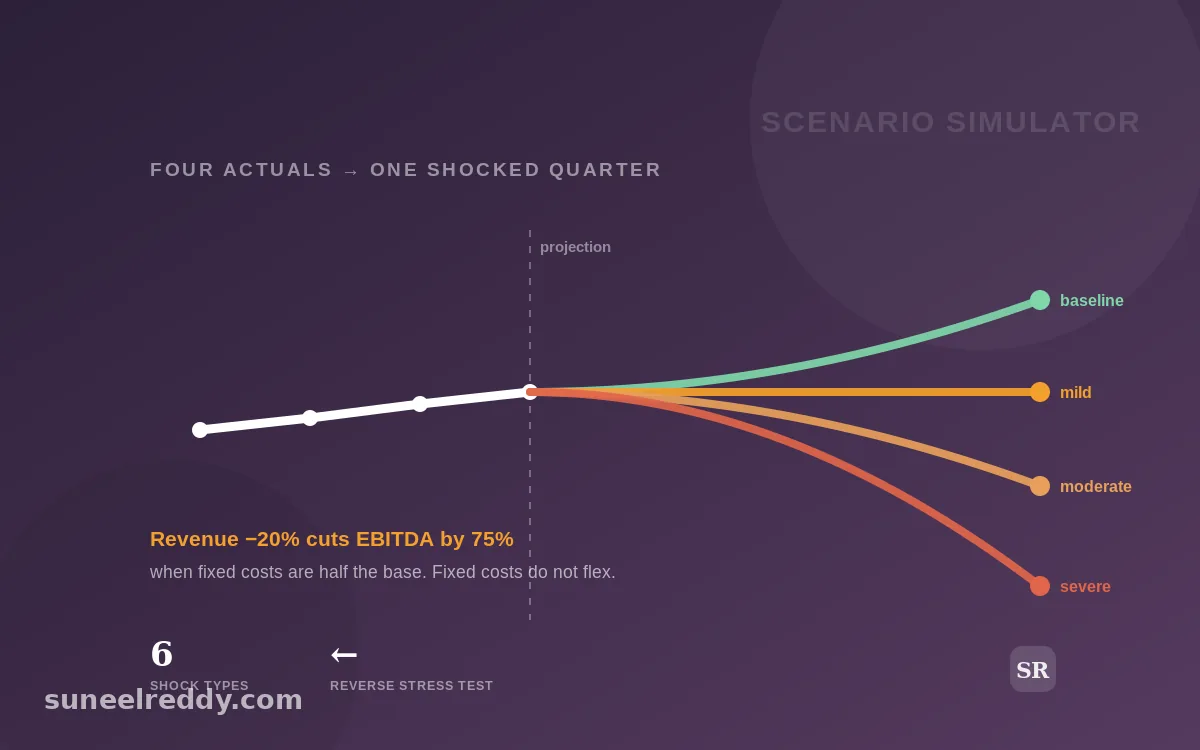
Enter four quarters of actuals, then shock the next one. Six shock types propagate through fixed costs, working capital and interest to land on cash — and a reverse stress test finds the exact magnitude of each shock that breaks the business.

Credit & Risk·Companion to the Stress Forecaster
Open the scenario simulator →
RAROC calculator — loan pricing components
Live

RAROC & Loan Pricing

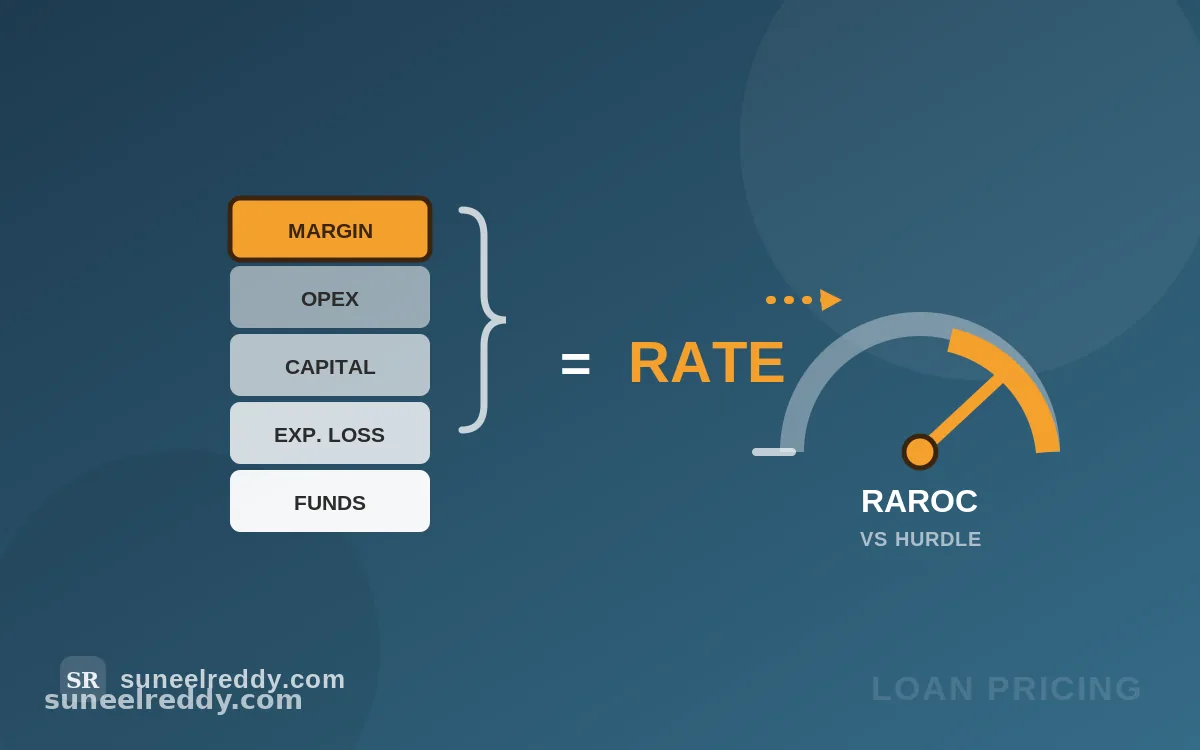
Build a lending rate from its components — cost of funds, expected loss, capital charge, operating cost — and test whether it clears your hurdle. Includes a break-even rate solver and four presets from MSME working capital to anchor-backed TReDS.

Credit & Risk·Companion to Building the Rate
Open the RAROC calculator →
Working capital and DSO calculator
Live

Working Capital & DSO

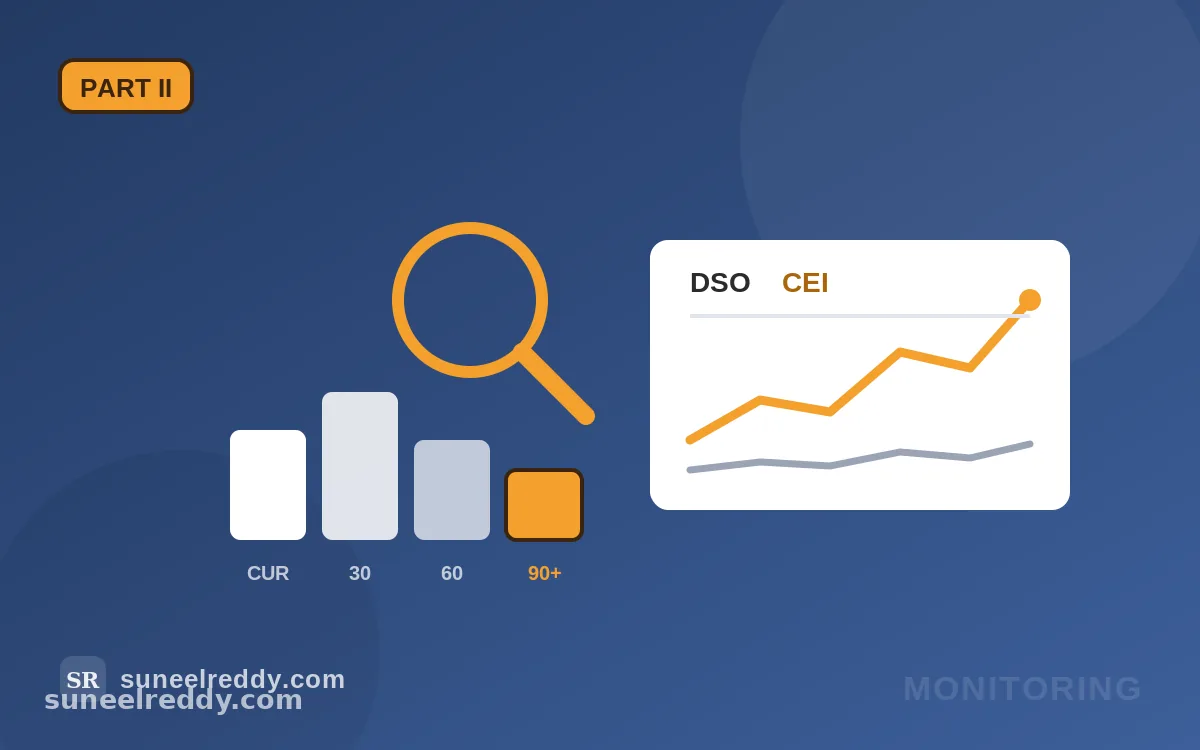
Model the cash conversion cycle — DIO, DSO, DPO — and see what a change in collection performance actually frees up in rupees. Separates the DSO you granted from the DSO you're suffering, with Best Possible DSO, Average Days Delinquent and the CEI benchmark.

Credit & Risk·Companion to B2B Credit, Part II
Open the working-capital calculator →
Expected Credit Loss provision matrix by ageing bucket
Live

Expected Credit Loss

An ECL provision matrix for trade receivables — a historical loss rate for every ageing bucket, a forward-looking macro overlay on top, and the Stage 1 / Stage 2 / Stage 3 split that sets your loss horizon. Four scenario presets from a benign cycle to a downturn.

Credit & Risk·Ind AS 109 / IFRS 9
Open the ECL calculator →
Credit limit sizing — four methods, take the lowest
Live

Credit Limit Sizing

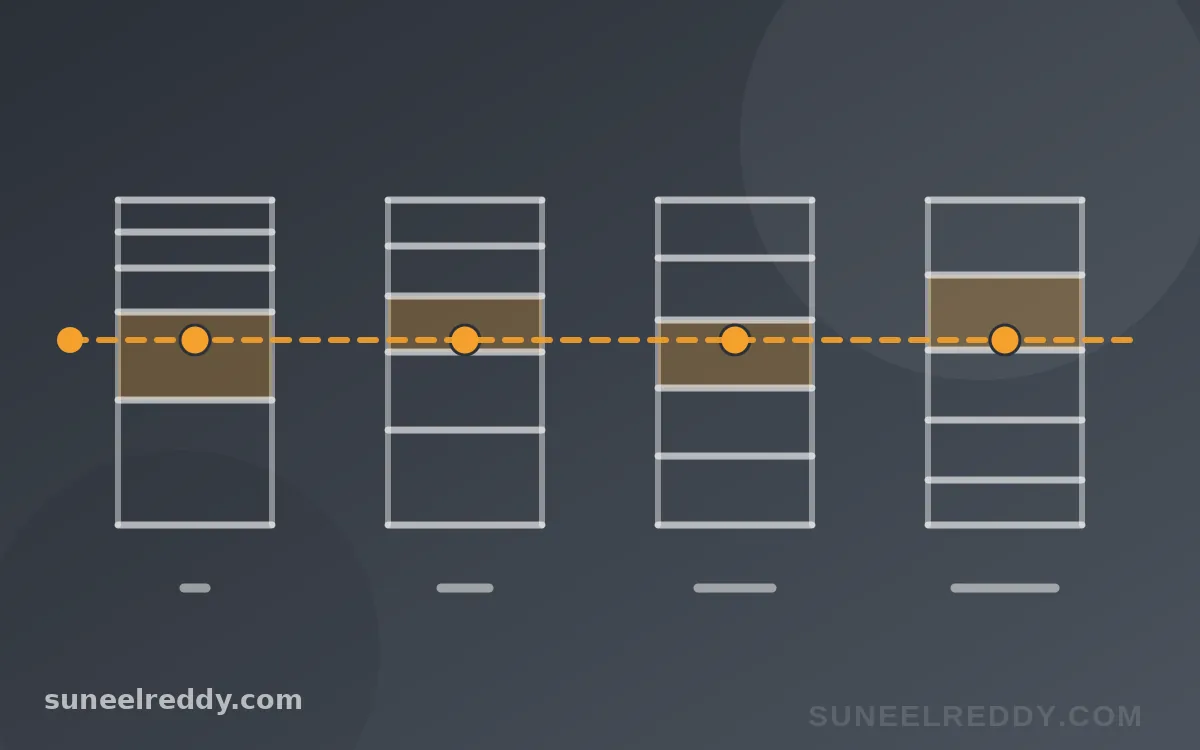
Run the four limit-setting methods side by side — requirement-based, capacity-based, insurer-led and portfolio concentration — and take the lowest, as you should. The binding method is highlighted, with the gap to the next-loosest shown as your growth headroom.

Credit & Risk·Companion to B2B Credit, Part I
Open the credit-limit calculator →

Why these exist

Most credit frameworks are published as prose and consumed as vibes. You read that expected loss is PD × LGD × EAD, nod, and go back to pricing off a grid. The arithmetic only changes behaviour when you can move a slider and watch the verdict flip.

So each calculator here pairs with a written framework. The writing explains why the components matter; the tool lets you find the point where your own numbers stop working. In my experience that second step is where the actual learning happens — particularly the moment a well-liked deal turns out to sit below the break-even rate.

Everything runs client-side in plain JavaScript. No accounts, no analytics on your inputs, nothing leaves your browser — which matters, because these get used with real portfolio numbers. All models are illustrative and simplify tenor, tax, transfer pricing and cross-sell economics. They are teaching tools, not credit decisioning systems.

If there's a framework you'd like turned into a calculator, tell me.