
Building the Rate: Risk-Based Pricing and RAROC in MSME Lending
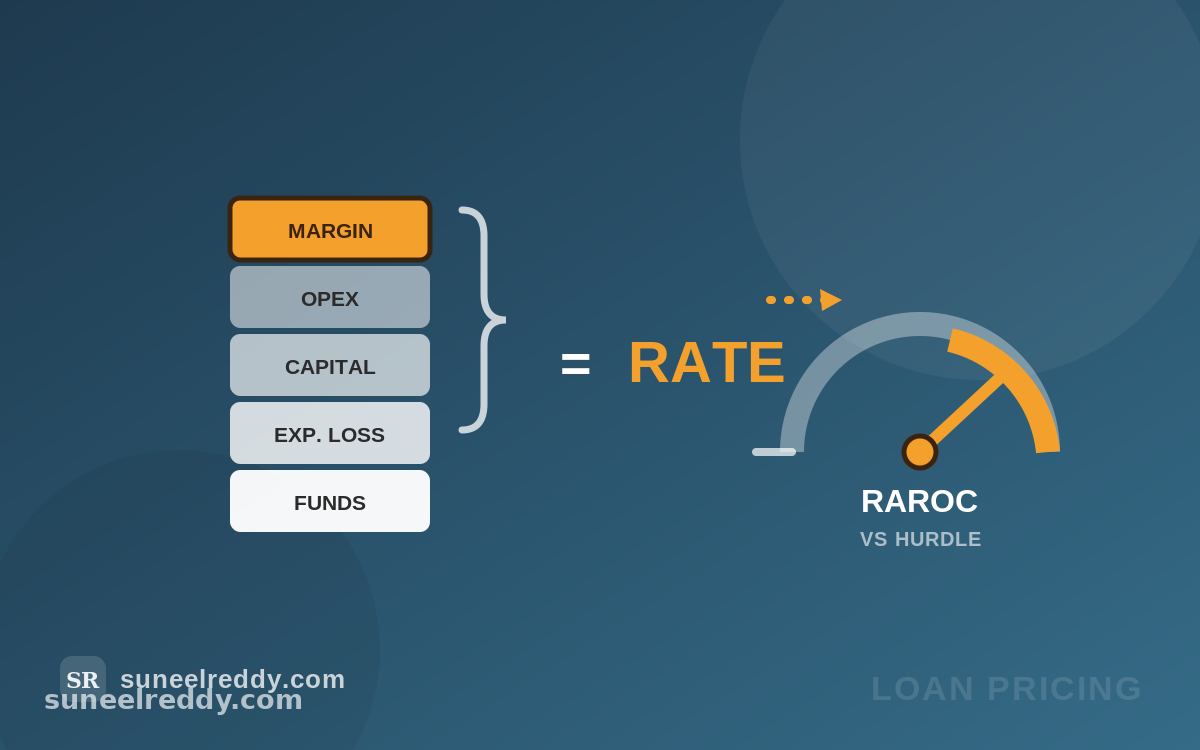
A technical construction of a loan price from its components, the RAROC test that governs it, and the pathologies that show up when lenders skip the arithmetic. Illustrative frameworks with indicative numbers — not lending or investment advice.
Every calculation in this paper is available as an interactive RAROC calculator — adjust PD, LGD, risk weight and price, and watch the verdict move.
Ask a relationship manager why a borrower is being quoted 13.5% and you will usually get one of two answers: “that's our rate for this segment,” or “that's what we need to win it.” Both are pricing by convention. Neither tells you whether the loan earns its keep.
A price is not a number pulled from a grid. It is a stack of costs, each of which has to be separately estimated and separately defended. This paper builds that stack.
The pricing identity
Every loan rate decomposes into five components:
Lending rate = Cost of funds + Expected loss + Cost of capital + Operating cost + Margin
Everything else in pricing is a refinement of that sentence. Take them in order.
Component 1: Cost of funds
The base is what the money costs you. For an Indian bank lending to MSMEs on a floating-rate basis, regulation has largely settled the mechanics: since October 2019 the RBI has required retail and MSME floating-rate loans to be linked to an external benchmark, in practice almost always the policy repo rate. The quoted rate is then EBLR = repo + spread, and the spread carries everything in components 2 through 5.
The important consequence is transparency of transmission. With the repo at 5.25% as of April 2026 — after a cumulative 125 basis points of cuts since February 2025 — a published EBLR of 10.00% is visibly repo 5.25 + spread 4.75. Under the older MCLR regime that decomposition was internal and rate cuts took six to twelve months to reach borrowers; under EBLR it is contractual and moves within a quarter.
For an NBFC there is no such anchor: cost of funds is a weighted average of bank term loans, NCDs, ECBs and securitisation, and it moves with the NBFC's own credit rating. That difference — banks fund off a policy rate, NBFCs fund off their own spread — explains most of the pricing gap between the two channels before a single risk assessment happens.
One discipline: use marginal, not average, cost of funds. Pricing new lending off a legacy deposit book that cannot be replicated is how institutions grow a portfolio that is unprofitable at the margin while looking profitable in aggregate.
Component 2: Expected loss
This is where the borrower's rating enters the price. The credit-risk premium is not a judgment call; it is an estimate:
Expected loss = PD × LGD × EAD
Probability of default, loss given default, exposure at default. Expressed as an annual percentage of exposure, EL is simply a cost of doing business — the average amount you expect to lose on a portfolio of borrowers who look like this one. It is not a risk buffer. It is a known cost, like electricity.
Worked, for a mid-market MSME on a working capital line:
- PD of 3% — roughly a CMR-5 borrower on a 12-month horizon
- LGD of 45% — partially secured, after realistic recovery haircuts and time-to-recovery discounting
- EAD of 100% of sanctioned limit — for a revolving line, assume it is fully drawn when things go wrong, because it will be
EL = 3% × 45% × 100% = 1.35% of exposure per year. That is 135 basis points that must be in the price before you have earned anything.
Three practitioner notes. LGD is jurisdictional — it embeds your recovery machinery, which is why the collections and insolvency regimes covered elsewhere in this series show up directly in pricing. EAD is behavioural — distressed borrowers draw down undrawn limits, so a credit conversion factor near 100% is prudent for revolving exposures. And PD must be calibrated, not merely rank-ordered; a model that separates good from bad beautifully but is miscalibrated will misprice every loan it touches.
Component 3: Cost of capital
Expected loss covers the average year. Capital covers the bad one — and shareholders charge for it.
Regulatory capital is the binding constraint in practice. Indian banks must hold a minimum CRAR of 9%, above the Basel III 8% minimum, against risk-weighted assets. Under the standardised approach, qualifying regulatory retail exposures — including MSMEs — attract a 75% risk weight, and the RBI's revised framework, effective April 2027, extends more granular and generally lower weights to MSME and certain other exposures.
The capital charge in the rate is then:
Capital cost = Exposure × Risk weight × CRAR × Cost of equity
On a ₹1 crore MSME limit at a 75% risk weight, 9% CRAR and a 15% cost of equity:
Capital held = 1,00,00,000 × 0.75 × 0.09 = ₹6,75,000 Annual charge = ₹6,75,000 × 15% = ₹1,01,250, or 1.01% of exposure.
Note what just happened: a change in risk weight is a change in price. When the RBI lowers risk weights on MSME exposures, it is directly subsidising the cost of MSME credit — about 34 basis points for every 25-point reduction in weight, at these parameters. That is the transmission channel most commentary on such announcements misses.
Sophisticated lenders price against economic capital — capital sized to the tail of their own loss distribution, typically via a VaR or expected-shortfall measure at a confidence level matching their target rating — rather than the regulatory floor. Where economic capital exceeds regulatory capital (concentrated books, correlated sectors), pricing off the regulatory number systematically underprices the risk.
Component 4: Operating cost
Origination, underwriting, documentation, servicing, monitoring, and collections — allocated per account, not as a flat percentage. This component is why small-ticket lending is structurally expensive: if it costs ₹25,000 to originate and service an account for a year, that is 2.5% on a ₹10 lakh loan and 0.25% on a ₹1 crore loan. Identical risk, tenfold difference in cost ratio.
Two implications follow. First, digital origination is not a customer-experience initiative, it is a pricing lever — it is the only way small-ticket MSME lending gets cheap enough to be viable. Second, collections cost belongs in the price, and pricing models that omit it flatter high-touch, high-delinquency segments precisely where the true cost sits.
Component 5: Margin
What is left is the return to shareholders — and the only component that is genuinely a choice. Which is why it should not be a residual plug. It should be the output of a test.
The RAROC test
RAROC — risk-adjusted return on capital — reframes the question from “what rate?” to “does this deal clear the hurdle?”
RAROC = (Revenue − Operating cost − Expected loss) ÷ Economic capital
Approve when RAROC ≥ the hurdle rate, which is the institution's cost of equity adjusted for tax and structure. Below it, you reprice, restructure, or decline.
Running our example — a ₹1 crore MSME working capital line:
| Component | Basis | Annual value |
|---|---|---|
| Interest revenue at 13.0% | 1 crore drawn | ₹13,00,000 |
| Fee income | Processing + renewal | ₹75,000 |
| Cost of funds at 7.5% | Marginal | (₹7,50,000) |
| Expected loss | PD 3% × LGD 45% | (₹1,35,000) |
| Operating cost | Allocated | (₹1,00,000) |
| Risk-adjusted return | ₹3,90,000 | |
| Capital allocated | 75% RW × 9% CRAR | ₹6,75,000 |
| RAROC | 57.8% |
Comfortably above a 15% hurdle — which tells you something important: at these risk weights, well-priced MSME lending is highly capital-efficient. The same borrower at 11.0% would produce a risk-adjusted return of ₹1,90,000 and a RAROC of 28.1%, still clearing. At 9.0%, the return falls to a loss after expected loss and operating cost. The pricing floor is not where the relationship manager thinks it is, and RAROC finds it in one line.
The framework also prices structure, not just borrowers. Moving the same exposure to an anchor-backed TReDS line cuts PD and LGD together; adding a CGTMSE guarantee lowers LGD and may lower the risk weight. Both raise RAROC at an unchanged rate — meaning the lender can offer a lower price for the same return. That is the entire commercial argument for structured lending, expressed as arithmetic.
Run your own numbers
Every calculation above is available as an interactive tool: the RAROC calculator.
Move PD, LGD, risk weight, cost of funds and price, and the verdict updates live — including a break-even rate, the price at which the deal exactly earns its hurdle. Four presets are built in: MSME working capital, secured term loan, unsecured small ticket, and anchor-backed TReDS.
Three things worth trying:
- Drop the risk weight from 75% to 50% and watch the required price fall. That is the RBI's MSME risk-weight easing, expressed as basis points a borrower actually feels.
- Switch to the TReDS preset. Lower PD, lower LGD, lower risk weight — and a RAROC that clears comfortably at a rate two to four points below the open working-capital line. The commercial case for structured lending, in one click.
- Take your worst-priced live deal and find its break-even. In my experience this is where the framework stops being theoretical.
It runs entirely in the browser — nothing is uploaded or stored, which matters when the inputs are real portfolio numbers. Other tools are on the way at suneelreddy.com/calculators.
Where pricing goes wrong
Five pathologies, in rough order of frequency:
- Grid pricing. A rate card by segment and ticket size, unlinked to PD. Every good borrower in the grid is overpriced and leaves; every bad one is underpriced and stays. This is adverse selection manufactured internally, and it degrades a book quietly over years.
- Pricing to win. Discounting to hit disbursement targets, with the shortfall never attributed to the deal. The RAROC discipline is precisely that exceptions must be visible and approved, not absorbed.
- Average cost of funds. Pricing off a legacy funding book, as above.
- Ignoring undrawn exposure. Charging nothing for committed but undrawn limits, which carry both capital and drawdown-at-distress risk. This is what commitment fees exist for.
- Static pricing. Rates set at origination and never revisited as the borrower migrates across grades. A borrower who has drifted from CMR-4 to CMR-7 is being carried at a price that no longer covers their expected loss — which is where the early-warning framework should feed the renewal desk, and usually doesn't.
The closing point
Everything in this series converges here. The rating model estimates PD. The recovery regime determines LGD. The early-warning system tells you when PD has moved. The collections function determines both LGD and operating cost. And the price is where all four are finally expressed as a single number the borrower actually sees.
Which is why pricing is a poor place to compete on instinct. A lender that prices by conviction and one that prices by construction may quote the same rate on any given deal. Over a portfolio and a cycle, only one of them knows which deals were worth doing.
References
RBI — External Benchmark Lending Rate framework (September 2019 circular; repo-linked pricing for retail and MSME floating-rate loans); Master Circular on Basel III Capital Regulations (minimum CRAR 9%); Draft revised standardised approach for credit risk (75% risk weight for regulatory retail including MSME; effective April 2027). Basel Committee — Basel III standardised approach for credit risk. RAROC literature — Risk Capital Attribution and Risk-Adjusted Performance Measurement (GARP/FRM curriculum); Umbrex, AnalystPrep — RAROC formulation and hurdle-rate application. Indicative rates as of mid-2026: policy repo 5.25%; illustrative EBLR 10.00% (repo 5.25 + spread 4.75). All worked figures are illustrative.