
The Freshwater Ledger
There is a comforting fact people reach for whenever water comes up: the Earth's water is a closed system. Nothing is created, nothing is destroyed. The glass of water on your desk contains molecules that have been through dinosaurs, glaciers, and the Roman aqueducts.
All of that is true. It is also one of the most misleading true things in earth science.
Water is conserved. Usable water is not. Every reservoir that holds fresh water in a form we can reach — aquifers, glaciers, lakes, soil — is an account, and every account can be drawn down independently of the global total. Water pumped from an aquifer in Punjab isn't destroyed; it evaporates from a wheat field, falls as rain somewhere else, and eventually reaches the sea. The molecules are fine. The account is not.
We have been keeping receipts on those accounts for about a century now, and the satellite record since 2002 is good enough to audit them line by line. So let's open the ledger.
What is actually in the accounts
Earth holds roughly 1.386 billion cubic kilometres of water, of which about 2.5 percent — some 35 million km³ — is fresh. That fresh share is distributed with wild inequality.
| Reservoir | Volume (km³) | Share of fresh water |
|---|---|---|
| Glaciers and ice caps | 24,064,000 | 68.7% |
| Groundwater | 10,530,000 | 30.1% |
| Ground ice and permafrost | 300,000 | 0.86% |
| Freshwater lakes | 91,000 | 0.26% |
| Soil moisture | 16,500 | 0.05% |
| Atmosphere | 12,900 | 0.04% |
| Rivers | 2,120 | 0.006% |
Rivers — the thing most of human civilisation is physically built along — are a rounding error. They matter because they refill fast, not because they hold much. About 40,000 to 45,000 km³ of runoff moves through them annually, and that flow, not the stock, is what we actually live on.
Two accounts hold 98.8 percent of the fresh water: ice and groundwater. Both are being spent.
Groundwater has the longest record
Groundwater has the deepest paper trail, because we have been drilling and metering it for over a century. The USGS hydrologist Leonard Konikow assembled the canonical reconstruction in 2011, aquifer by aquifer, back to 1900. The shape of that record is the single most important thing in this article.
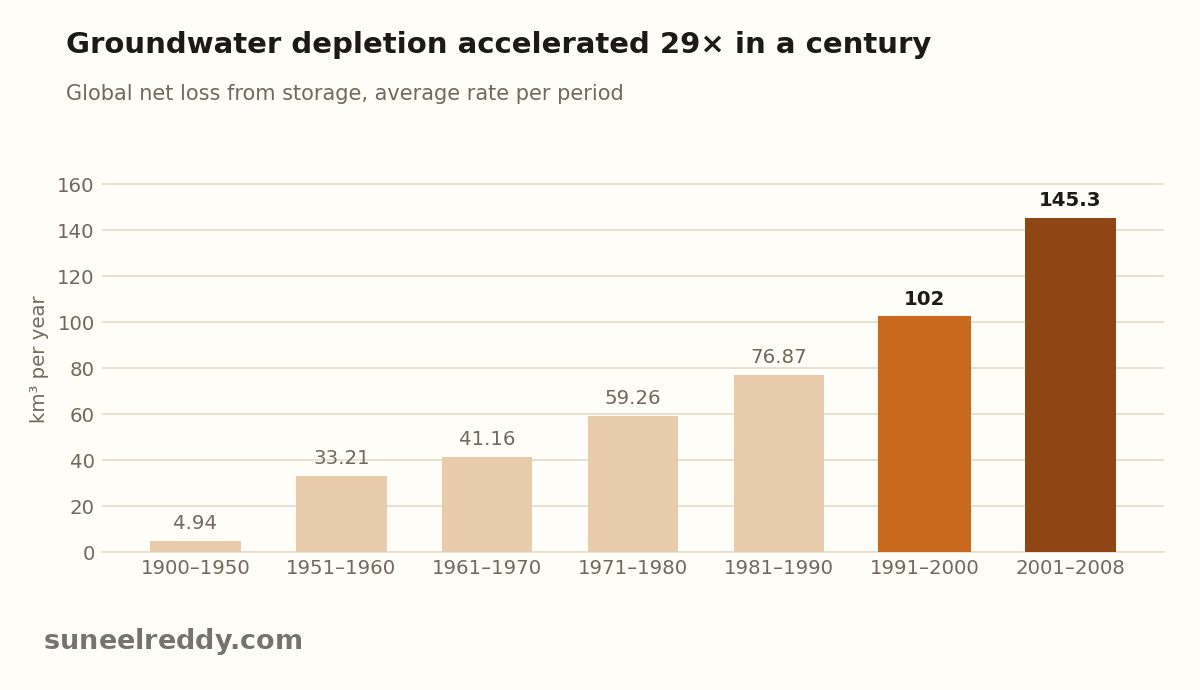
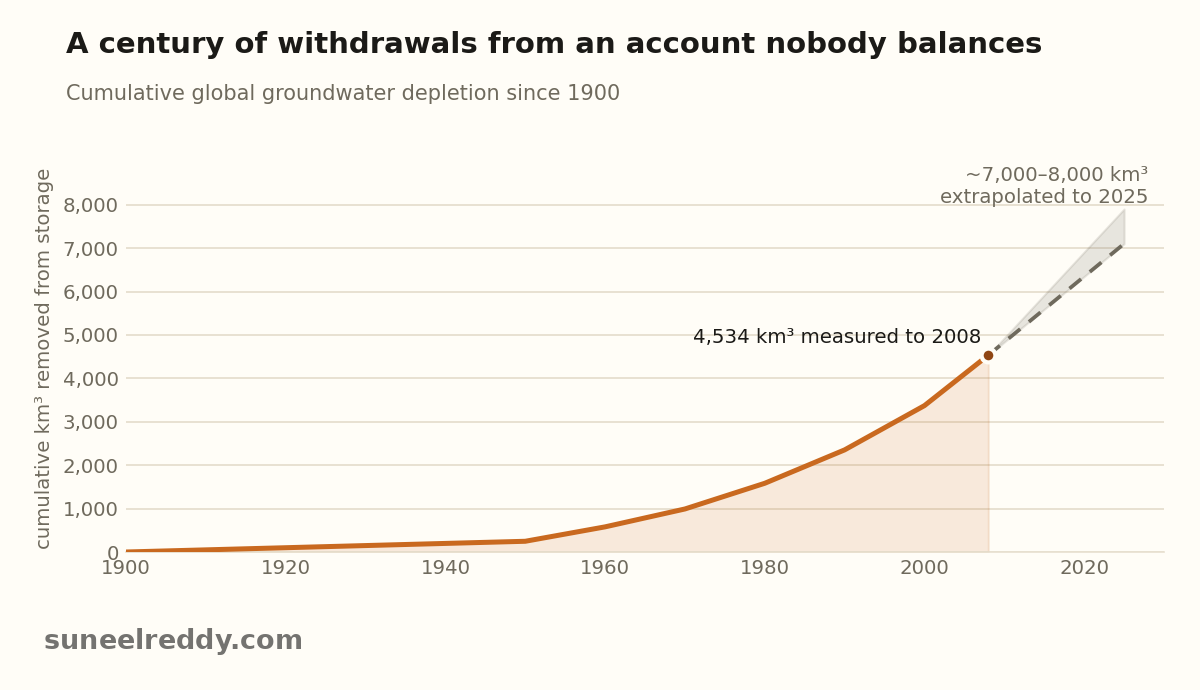
For the first half of the twentieth century, the world removed net groundwater from storage at about 5 km³ a year. By the 2000s that rate had reached 145 km³ a year — a twenty-nine-fold acceleration, driven almost entirely by cheap electric and diesel pumps meeting the irrigation demands of the Green Revolution. The cumulative bill comes to 4,534 km³ between 1900 and 2008, and 95 percent of that was taken after 1950. The first half of the century barely registers.
One distinction matters here, because the two numbers get confused constantly. The world withdraws about 959 km³ of groundwater a year, roughly 69 percent of it for agriculture. Most of that returns: it recharges, it runs off, it comes back. Depletion is only the residue that does not — the net drawdown of storage. Everything in the table above is the residue.
Konikow's series ends in 2008, and nobody has published an equally rigorous global reconstruction since. On any reasonable continuation of the trend, humanity has now mined somewhere in the region of 7,000 to 8,000 km³ of groundwater — about one and a half times the volume of Lake Michigan, taken out of the ground and, for practical purposes, put into the ocean.
Two things keep this from being an abstraction.
The first is that it is independently detectable in the physical behaviour of the planet. Enough mass has moved from continental interiors to the oceans that it has measurably shifted Earth's rotational pole, about 80 centimetres eastward between 1993 and 2010. Models of polar drift did not match observations until groundwater redistribution was added to them. We have pumped enough water to nudge the spin of the Earth.
The second is that the losses are not spread thinly across the globe. They are concentrated in a handful of places that happen to grow a disproportionate share of the world's food. Northern India and Pakistan alone account for 1,361 km³ — thirty percent of the entire twentieth-century global total, drawn from one agricultural region. The Arabian aquifers account for another 468, the High Plains Ogallala 353, the US Gulf Coastal Plain 266.
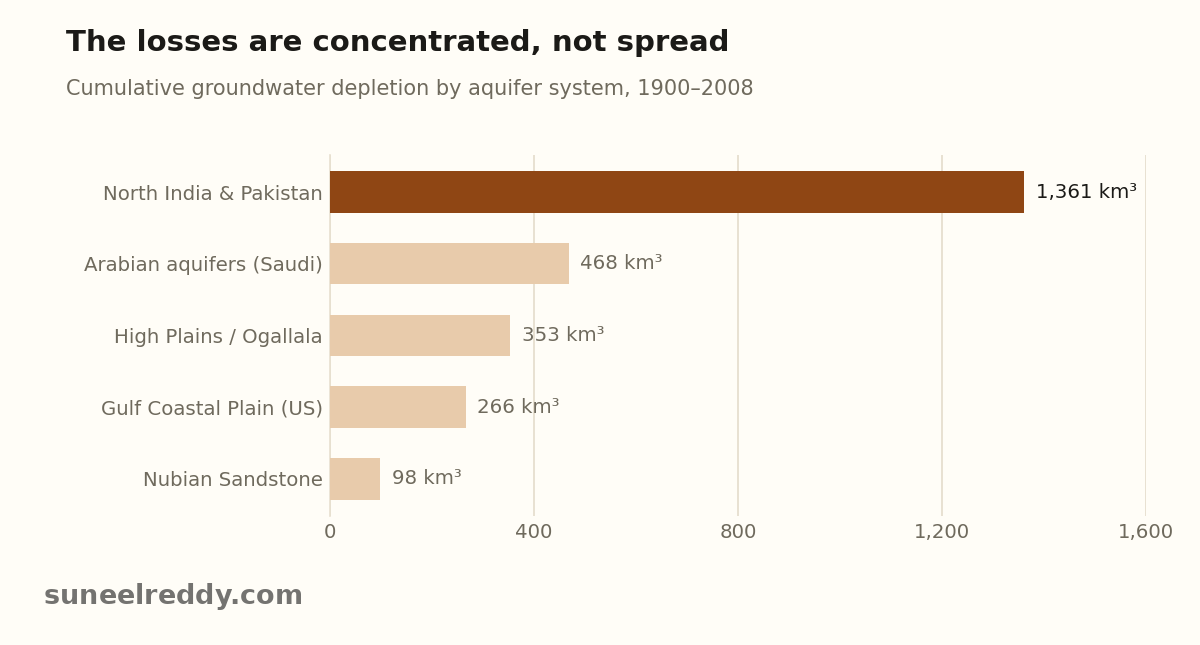
This is the crucial correction to the “0.06 percent of total groundwater” framing that makes depletion sound trivial. The denominator is wrong. What is at stake is not all groundwater; it is the shallow, rechargeable, economically pumpable fraction sitting under specific breadbaskets. Much of what is being extracted accumulated over thousands to millions of years. That is mining, not harvesting.
Ice is the largest account
Glaciers outside the great ice sheets feed the rivers of perhaps two billion people. A 2025 reconstruction combining field measurements from about 500 glaciers with satellite elevation data on 207,000 of them put the loss at 9,179 gigatonnes between 1976 and 2024 — 25.3 mm of sea-level rise.
The distribution of that loss inside the period matters more than the total. Forty-one percent of it occurred in the last decade alone, and 2023 by itself accounted for six percent of the entire forty-eight-year loss.
The ice sheets tell the same story with a different accent. The IMBIE consortium's synthesis of fifty satellite estimates puts Greenland and Antarctica's combined loss at about 7,560 Gt between 1992 and 2020 — 21 mm of sea level. Their rate went from 105 Gt/yr in the early 1990s to 372 Gt/yr by 2016–2020. A three-and-a-half-fold acceleration in under thirty years.
Notice the pattern repeating. Every account is not just declining but declining faster.
Lakes, and what a fully spent account looks like
Satellite altimetry covering 1992 to 2020 found that 53 percent of the world's largest lakes and reservoirs have lost storage, at a net rate on the order of 20 gigatonnes a year — the equivalent of draining seventeen Lake Meads. Roughly two billion people live in basins where the lakes are shrinking. Climate and consumption dominate for natural lakes; sedimentation dominates for older reservoirs. Twenty-four percent gained water, mostly on the Tibetan Plateau and behind new dams, which is not really good news either, since it mostly means glacier melt has to go somewhere.
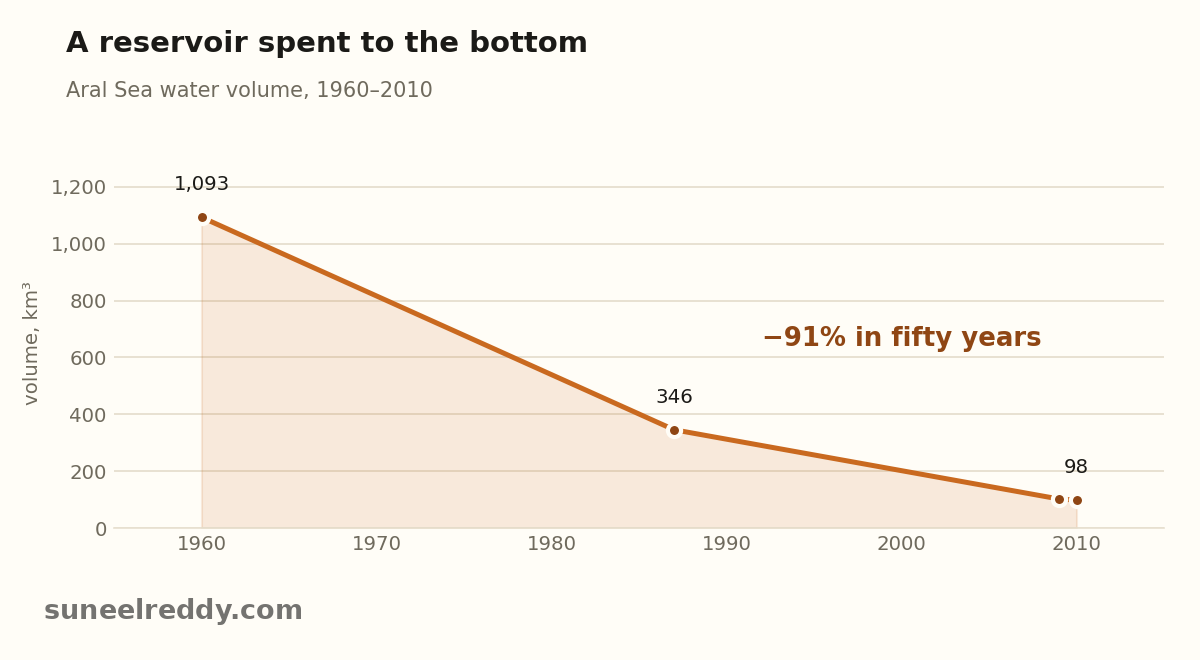
For what a fully spent account looks like, there is the Aral Sea. From 1,093 km³ in 1960 to 346 by 1987 to 98 in 2010 — a ninety-one percent loss in fifty years, with salinity up from 10 g/L to 130 g/L. No drought caused this. Soviet planners diverted the Amu Darya and Syr Darya to irrigate cotton, and the irrigated area went from 45,000 km² in 1960 to 70,000 km² by 2000. The Aral Sea is not a warning about climate. It is a warning about arithmetic.
The finding that reframes everything
The most consequential entry in the ledger is also the newest.
In July 2025, a team led by Hrishikesh Chandanpurkar and Jay Famiglietti published a synthesis of twenty-two years of GRACE gravity data in Science Advances. Their finding: total terrestrial water storage — all the water on land, groundwater plus soil moisture plus surface water plus snow — is declining at 324 gigatonnes a year. Over the satellite era, that is roughly 7,100 Gt gone from the continents.
The drying is spreading geographically at 831,600 km² a year, about twice the area of California, annually. Four continental-scale mega-drying regions have emerged, all in the northern hemisphere. Roughly 75 percent of the world's population — six billion people in 101 countries — now lives somewhere that has been losing fresh water since 2002. And 68 percent of the land water loss outside the glaciated regions is groundwater. The account with the longest record is still the one doing most of the damage.
Then comes the number that reorganises how you should think about all of this. Of the land-based contribution to sea-level rise between 2002 and 2024, continental land water accounts for 44 percent, at 0.89 mm a year. The Greenland ice sheet accounts for 37 percent, at 0.73 mm. Antarctica accounts for 19 percent, at 0.37 mm.
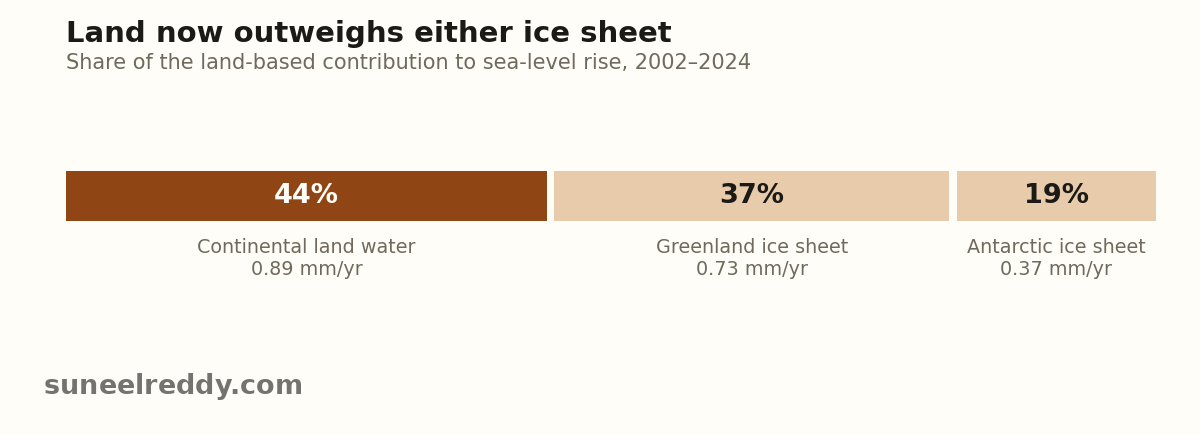
Land water now contributes more to sea-level rise than Greenland does, and more than twice what Antarctica does. The story we tell about rising seas is a story about melting ice. It is at least as much a story about pumped and evaporated water from continents — a far more mundane, and far more governable, process.
Adding it up
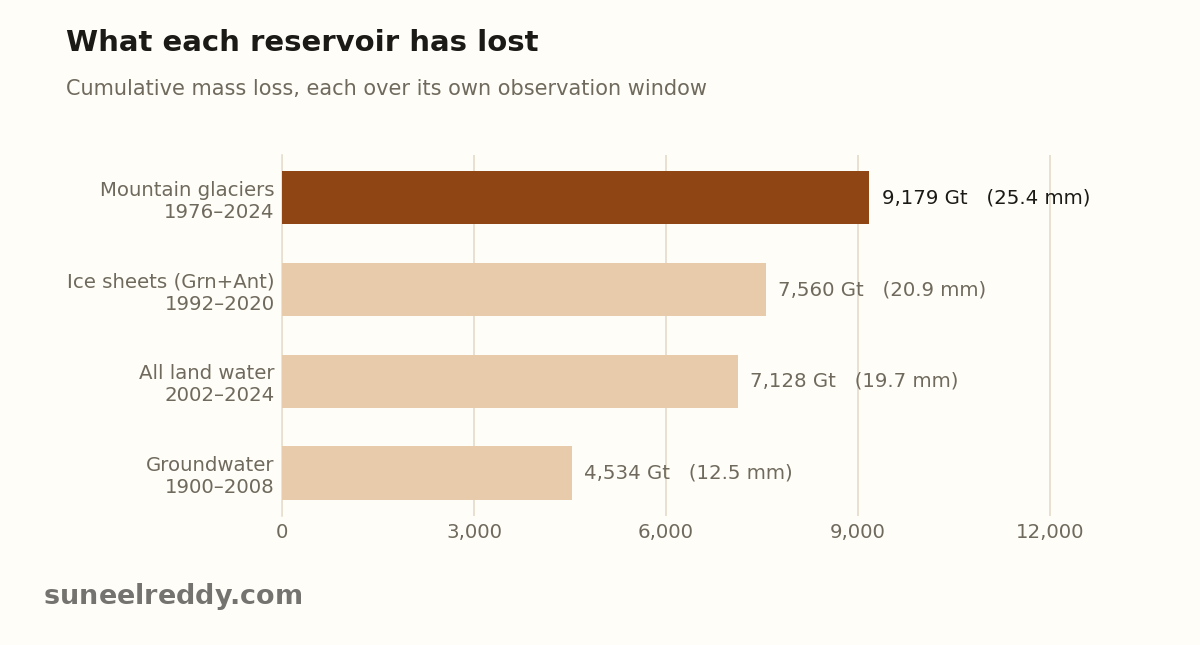
What the ledger shows is not four independent problems. It is one direction. Ice, groundwater, lakes and soil are all transferring mass from land storage into the ocean, all of them faster than they were a generation ago, and the transfer is large enough to register in sea level and in the rotation of the planet.
Two honest caveats before anyone quotes these numbers. First, the estimates carry real uncertainty — Konikow's global depletion rate and Yoshihide Wada's differ by roughly a factor of two, because they use different methods and different assumptions about what counts as depletion. The direction and order of magnitude are solid; the third significant figure is not. Second, the periods above start in different years, so each line shows what that account lost during its own observation window, not a common era.
The account that isn't closed
It would be easy to end there. The honest ending is more interesting.
In 2024, a team analysed water levels from 170,000 wells across 1,693 aquifer systems in more than forty countries — the most granular look at global groundwater ever assembled. The bad news was expected: 36 percent of aquifers declining faster than 0.1 m a year, 12 percent faster than half a metre, and 30 percent dropping faster than they were in 1980–2000.
But 20 percent of long-monitored aquifers had slowed their decline. Sixteen percent had reversed it. Thirteen percent were rising.
Those reversals were not accidents. Bangkok introduced groundwater pumping fees in the early 2000s and turned its losses around. Union County, Arkansas was losing two metres a year in 1997; it imposed a pumping fee and spent $65 million to pipe in river water instead, and by 2004 the aquifer stood 36 metres higher. Near Tucson, Arizona, engineered recharge has been refilling the Avra Valley aquifer with Colorado River water since 2008.
Small, unglamorous, local, and boring: price the water, measure the wells, find a substitute supply, recharge deliberately. It works, and it works fast enough to show up in the data within a decade.
The total amount of water on Earth is fixed by physics. The balance of every account we actually draw from is fixed by policy. Those are very different kinds of fixed, and confusing them is how a solvable problem gets mistaken for a law of nature.
Sources
- Konikow, L.F. (2011). Contribution of global groundwater depletion since 1900 to sea-level rise. Geophysical Research Letters / USGS.
- Chandanpurkar, H.A., Famiglietti, J.S., et al. (2025). Unprecedented continental drying, shrinking freshwater availability, and increasing land contributions to sea level rise. Science Advances 11(30).
- Jasechko, S., et al. (2024). Rapid groundwater decline and some cases of recovery in aquifers globally. Nature.
- Yao, F., Wang, J., et al. (2023). Satellites reveal widespread decline in global lake water storage. Science.
- Seo, K.-W., et al. (2023). Drift of Earth's pole confirms groundwater depletion as a significant contributor to global sea level rise. Geophysical Research Letters.
- Dussaillant, I., et al. (2025). Annual mass change of the world's glaciers from 1976 to 2024. Earth System Science Data / WGMS.
- The IMBIE Team (2023). Mass balance of the Greenland and Antarctic ice sheets from 1992 to 2020. Earth System Science Data.
- Gaybullaev, B., et al. (2012). Changes in water volume of the Aral Sea after 1960. Applied Water Science.
- USGS Water Science School. How Much Water Is There on Earth?