
Two Categories Are Doing Most of the Work in Telangana’s Inflation
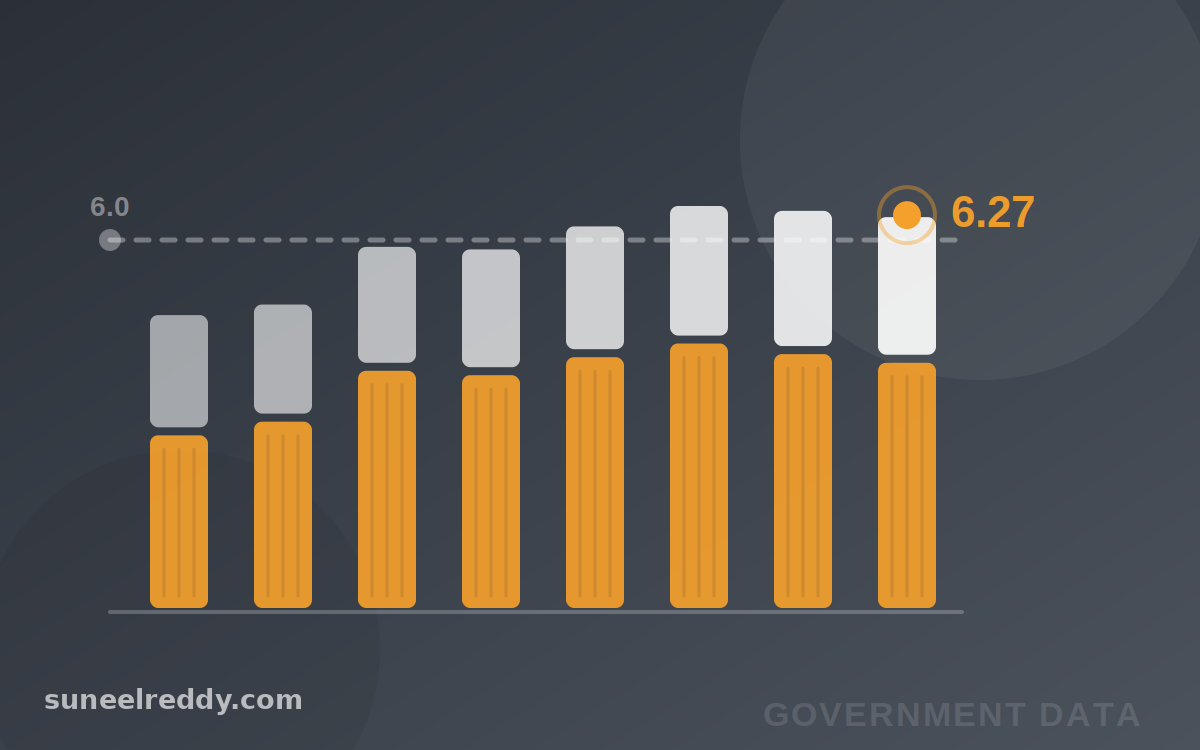
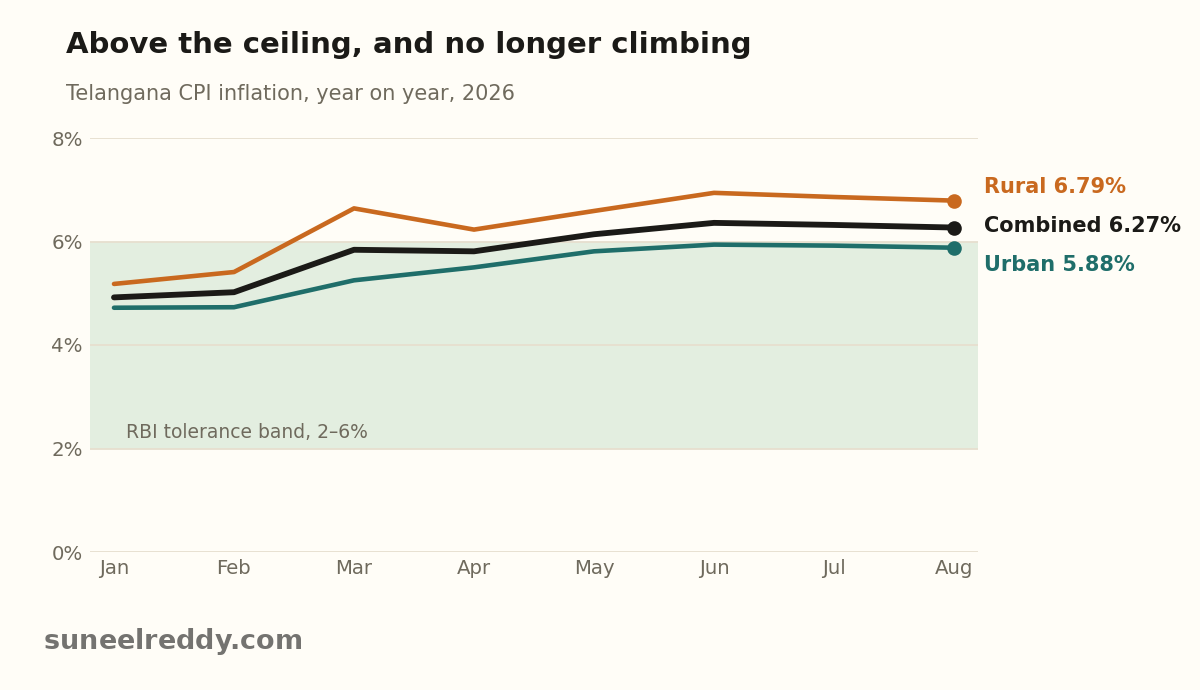
Telangana's retail inflation came in at 6.27% for August. That sits just above the 6% upper edge of the RBI's tolerance band, and on its own it tells you almost nothing about what to worry about.
The rate peaked at 6.36% in June and has eased by a hair in each month since. Prices rose 0.22% in August, the smallest monthly increase since February. Read the headline alone and you would call this a plateau. I don't think that is the right way to read it.
A headline is a weighted sum, so weight it.
The state series breaks prices into twelve spending categories, each with its own inflation rate. The fastest is personal care and miscellaneous goods at 27.9%, then restaurants and hotels at 10.7%. Those are the numbers that get quoted. But a category moves the headline only in proportion to its share of the household budget. Using the all-India weights MoSPI published with the new 2024-base series — Telangana's own have not been released — you can rebuild the state's headline from its parts. It comes to 6.24% against the reported 6.27%, close enough to work with.
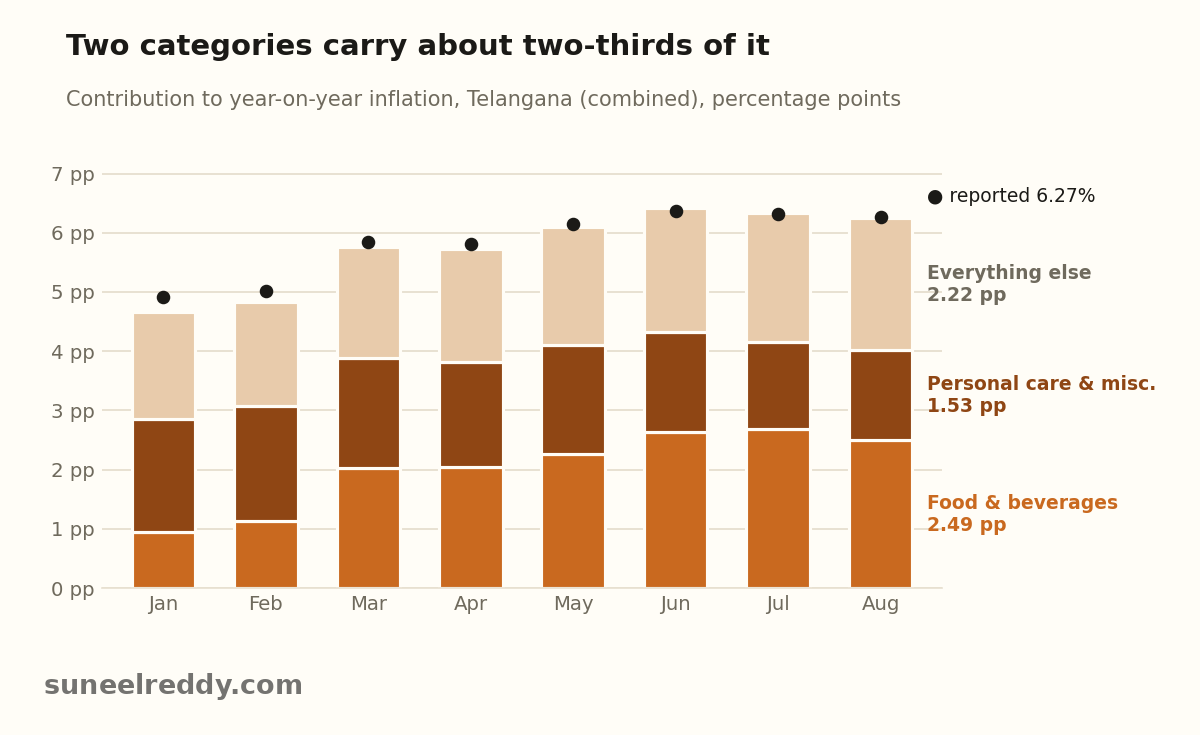
Done that way, the picture changes. Food and beverages add 2.49 percentage points. Personal care adds 1.53. Two categories account for about two-thirds of Telangana's inflation. Restaurants, for all their 10.7%, add 0.36 points, because eating out is about 3% of the basket. Housing, rising at a sleepy 3%, adds more than restaurants do, because it is nearly 18% of it.
The two big drivers are not the same kind of problem.
Personal care is almost certainly a precious-metals story; jewellery sits in that division. Its index rose about 37% between January 2025 and February 2026 and has moved sideways since. In January it was the single largest contributor to inflation, at 1.91 points. Food took over in March, as its own rate climbed from 2.6% in January to a peak of 7.4% in July before prices dipped in August.
Both are volatile and both are driven from the supply side. They will do what they do. What interests me is what is left when you take them out.
Strip them out and inflation is 3.8% — and it has risen every single month since February.
It was 3.0% in February, then 3.2, 3.3, 3.4, 3.6, 3.75 and 3.81% in August. No single jump; a steady grind. Transport stepped up in May and June — a 1.8% and then a 2.6% monthly rise, which has the look of a fuel price revision — and has stayed there. School fees reset higher this June and July than they did a year ago, about 5.7% against roughly 3.3%. Restaurant prices took a 2.7% jump in April and kept climbing. None of this is dramatic. Together it is the difference between a price shock and prices that are starting to move on their own.
Rural households feel more of it. Rural inflation is 6.79% against 5.88% urban, and on the same stripped-down measure rural sits at 4.1%. Food takes a bigger share of a rural budget, and clothing prices are rising almost three times as fast in rural areas as in towns.
The next five months will flatter the headline.
Year-on-year inflation compares today with the same month last year, and last year's prices jumped late: up 0.87% in November 2025, 0.55% in December and 0.77% in January. That high base will pull the rate down.
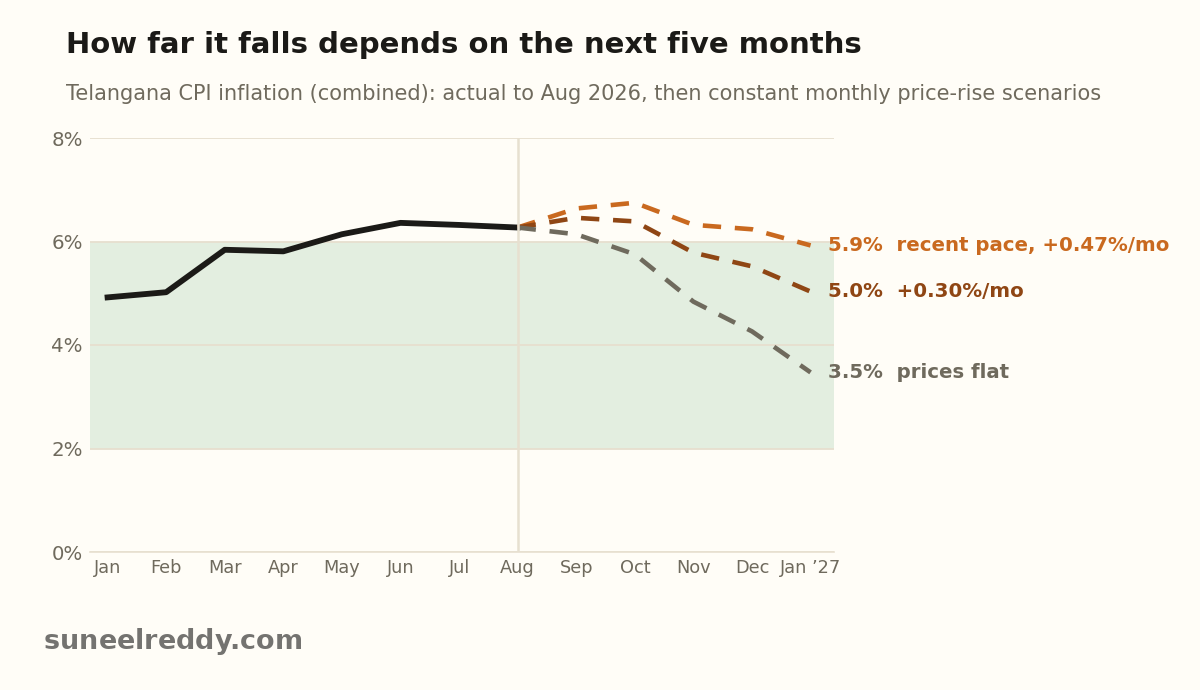
How far depends on what prices do from here. If they stay flat, inflation falls to about 3.5% by January 2027, and roughly half of that fall is personal care alone: if metal prices hold where they are, its contribution goes from 1.53 points to almost nothing. If prices rise 0.3% a month, the rate lands around 5%. At the pace of the last three months — 0.47% a month — it rises to about 6.75% in October and is still near 5.9% in January.
So a falling headline this winter will be mostly arithmetic, and it will be easy to read as relief. The number to watch is the one underneath: whether inflation excluding food and personal care keeps edging up through the base effect, or finally turns.
I have put the full dataset into an interactive dashboard — rural and urban splits, each category's contribution, a month-by-month heatmap, and a slider to set your own price assumption for the months ahead.
When the headline falls, will anyone check what it fell from?
Data: Consumer Price Index (base 2024 = 100), Telangana, from the Ministry of Statistics and Programme Implementation's eSankhyiki portal. Category weights: PIB release of 12 February 2026.