
India Sells to 228 Countries. Thirty of Them Carry the Load.
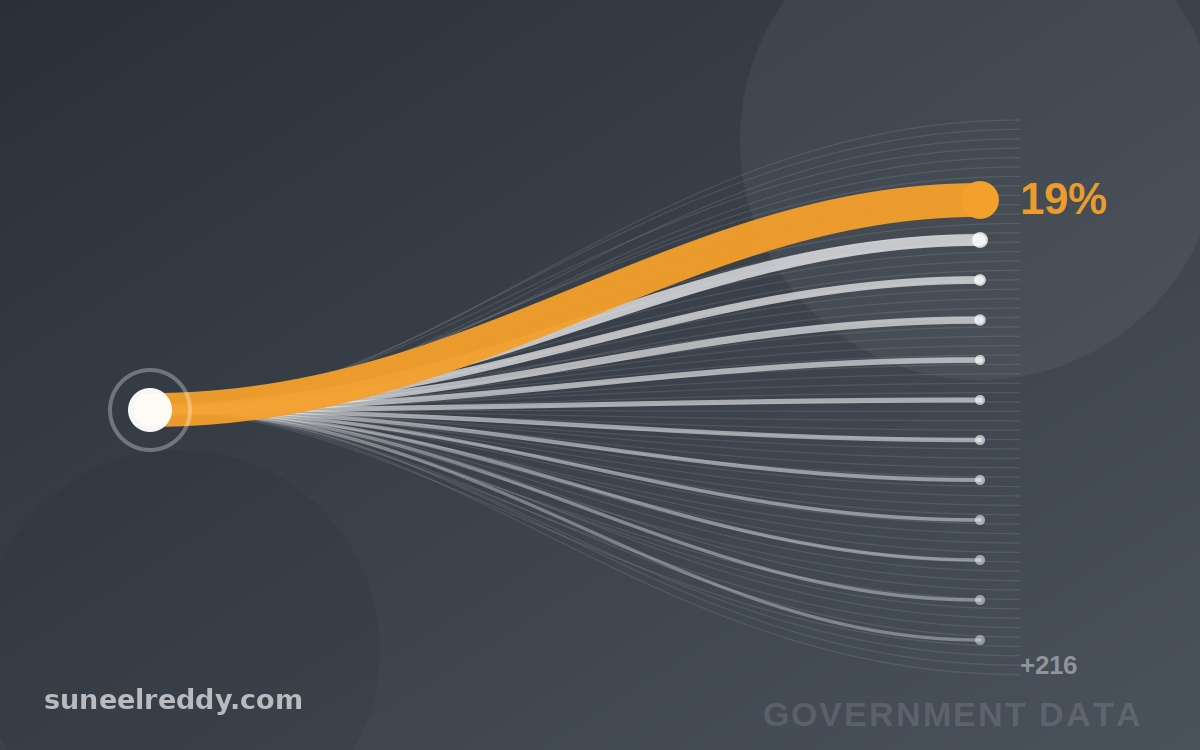
India sold $242 billion of goods abroad in the first seven months of 2026, to 228 destinations, through 392 ports. Those are the numbers that make a press release. They are also the least useful numbers in the dataset.
Thirty destinations take 80% of the value. The other 198 share what is left.
The United States alone takes 19%. The top ten — the US, the UAE, China, Singapore, the Netherlands, the UK, Germany, Bangladesh, Saudi Arabia and South Africa — take half. By the thirtieth market you have covered four-fifths of everything India exports. The long tail is real, and it matters to the firms that live in it, but it is not where the national number is made.
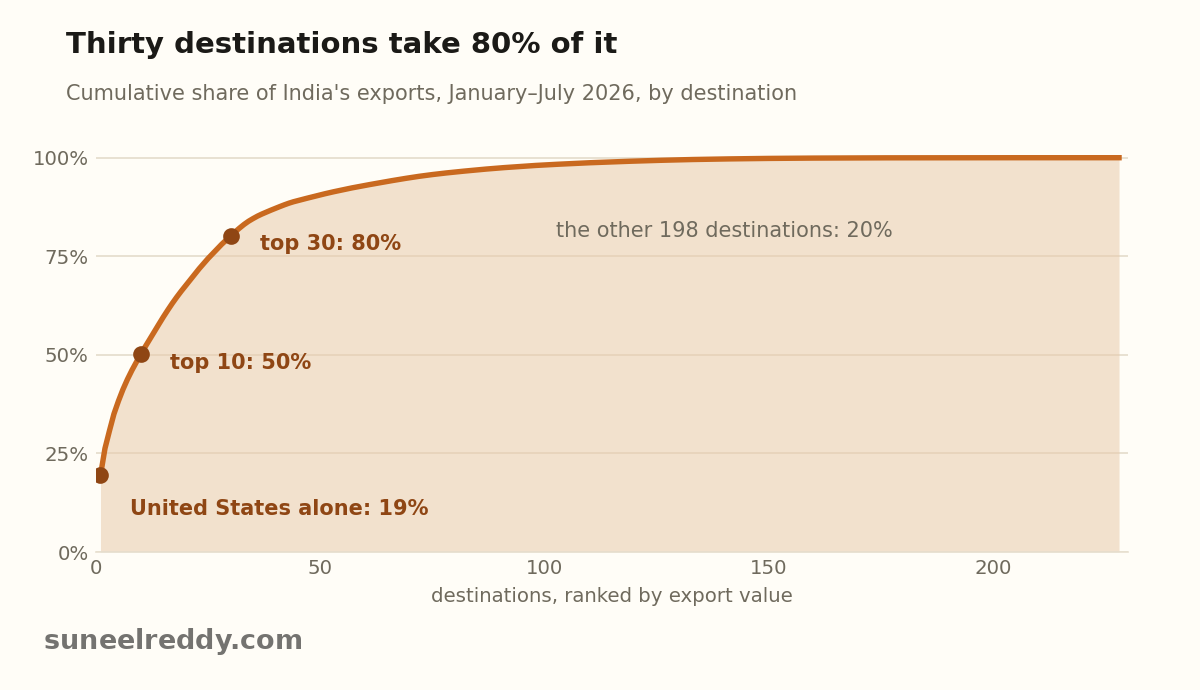
That shape is normal for a large exporter; trade follows income, distance and hubs. What makes it worth a closer look is what sits inside the biggest flows.
The largest single line is refined fuel, and more than half of it leaves from one place.
Petroleum products come to $35.5 billion, 15% of all exports. 54% of that shipped from one special economic zone, at Jamnagar. The buyers are not end markets so much as distribution points: Singapore takes 17%, Tanzania 9%, the Netherlands 8%. It is a refining business, and its export value moves with the oil price as much as with anything India does.
The second largest is phones, and they have one main customer.
Telecom instruments — mostly mobile phones — come to $20.5 billion. The United States takes 62% of them. Almost all of them leave by air, and more than half through a single airport, Chennai. Phones are now 27% of everything India sells to America, well ahead of drug formulations at 9%.
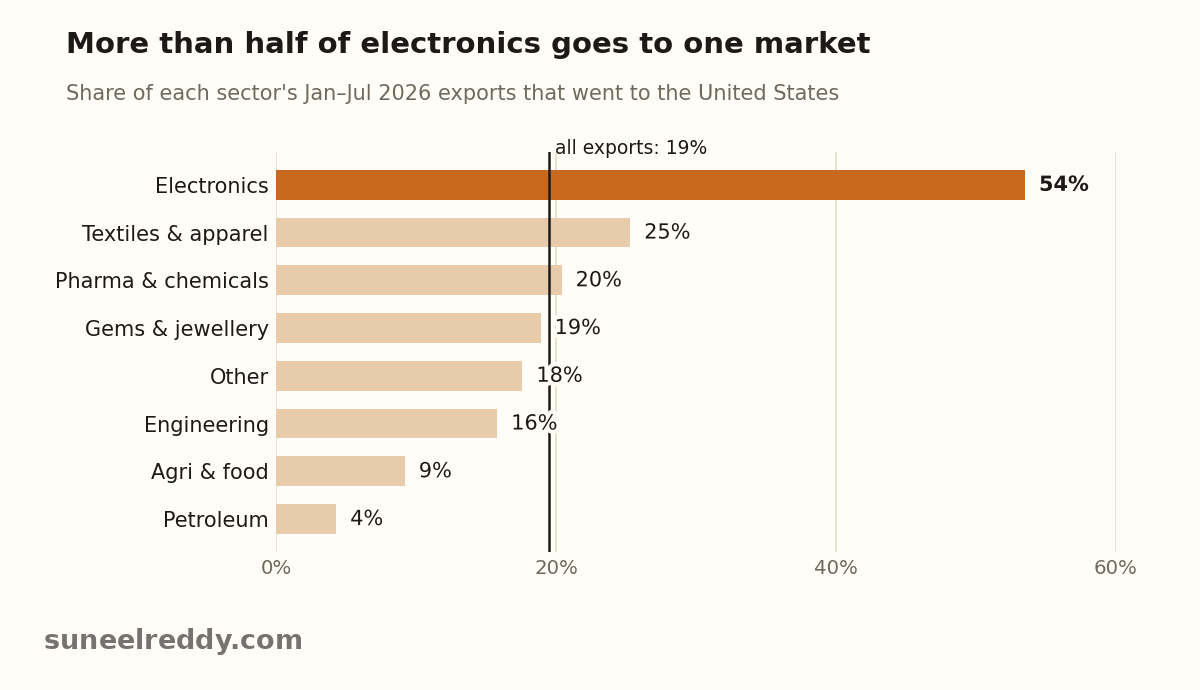
Widen the lens to whole sectors and the pattern holds. Electronics sends 54% of its exports to the US. Textiles and apparel send a quarter, pharma and chemicals a fifth. Agri and food sends 9% and spreads the rest widely. Petroleum barely touches America at all.
India's newest export success is also its most concentrated one.
That is not a flaw on its own. A dominant first buyer is how most manufacturing export stories begin: scale in one market is what pays for the factory, the tooling and the supplier base. The risk is not the dependence. It is treating the dependence as permanent. A tariff schedule, a sourcing decision at one brand, or a change in one trade relationship can move a large share of a sector's revenue within a quarter, and the national headline would barely register it until it had already happened.
The ports tell the same story from the other end.
Nhava Sheva handles 15% of export value by itself. Add the Jamnagar SEZ and Mundra, and three gateways carry 29%. Seaports move 44% of value and airports 20%, and phones alone account for about 40% of what goes by air. Land borders carry just under 3%, almost all of it to Nepal, Bangladesh and Bhutan.
None of this is hidden. It is simply not visible in a total. The question for the second half of the year is not whether the total grows. It is whether the ten-country share, and the one-market share inside electronics, start to come down — whether the new capacity finds its second and third buyers before it needs them.
I have put the full dataset — 201,510 commodity–destination–port flows — into an interactive atlas where you can filter by product, destination or port and see who buys what.
Which of India's big export lines could absorb losing its largest customer?
Data: India's merchandise trade by principal commodity, country and port, January–July 2026, from the Directorate General of Commercial Intelligence and Statistics (DGCI&S) Foreign Trade Data Dissemination Portal.